Following this major bacteriological attack, the Chinese economy had been almost at a standstill for 3 weeks. The closure of factories, offices, public places and the traffic ban have resulted in a vertical drop in energy consumption by China, the world's largest importer of oil and natural gas.
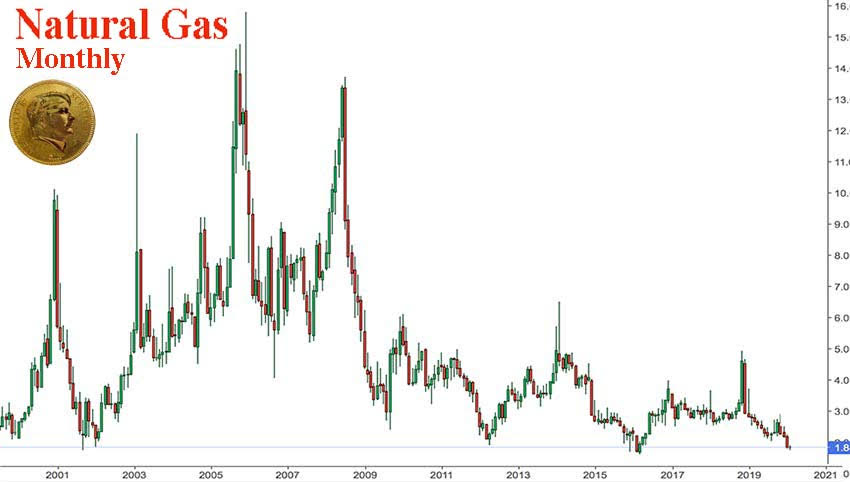
Natural gas has been on its floor for two months.
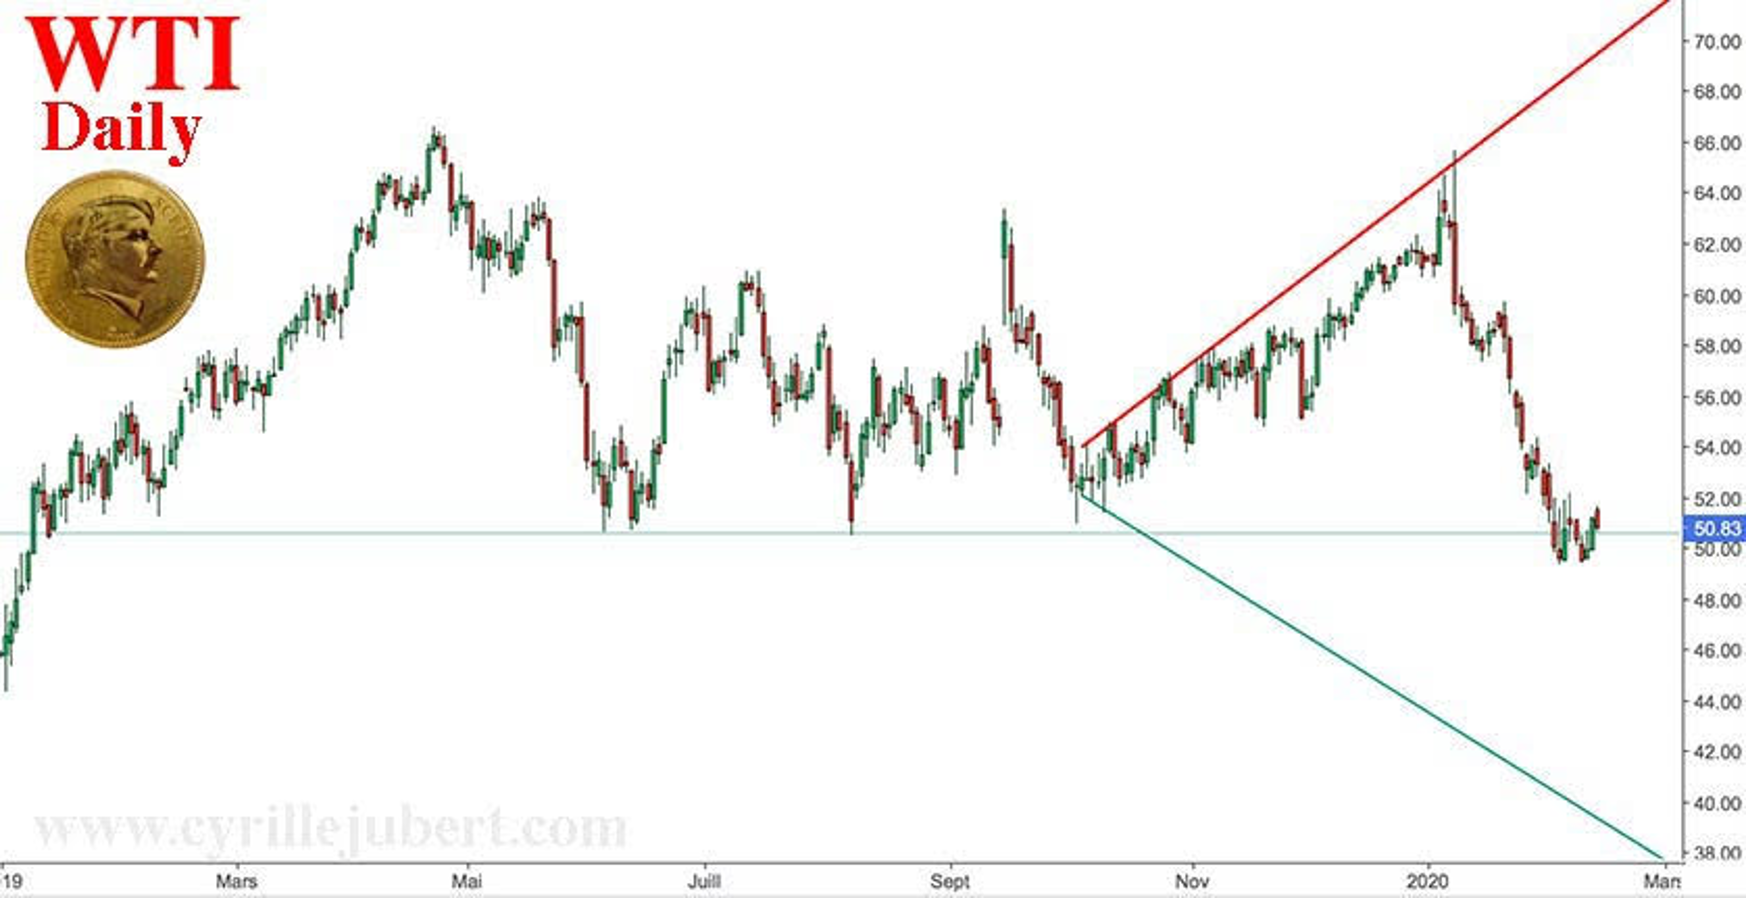
As for oil, it has been clinging desperately for two weeks to the support of $ 50, but this figure in a megaphone shows that it could drop very suddenly below $ 40.
The fall of the price of crude oil, in addition to that of the natural gas, would accelerate the bankruptcy of American companies in oil and shale gas. They have been operating at a loss for a long time.
For the past 6 months, the hundreds of billions of dollars injected by the Federal Reserve into the REPO market, have inflated the stock markets, which are rising without taking into account that the production chain of the World plant is seized up. The Chinese aluminum production line will not be operational until February 20, according to the Shanghai Metals Market. The same is true for most Chinese industries.
Many industries in the West will find themselves blocked by the disruption of the supply chain. The distribution will find itself out of stock of many products and the transport sector will be disaster, due to the air gap in Chinese exports.
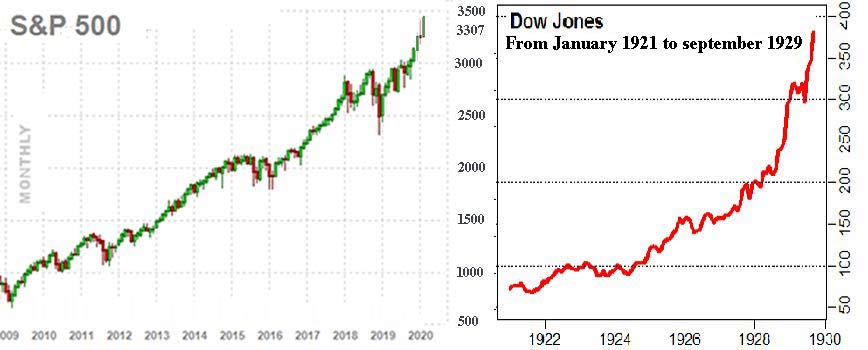
This stock market rally could end abruptly like that of 1929
If so, the US indices would have a 50% fall potential, up to their 200-month moving average.
The worsening pandemic in China this week, possibly because authorities have allowed factories to reopen too soon, suggests that the freezing of the Chinese economy could be much longer and more severe than expected. The contagion of this economic flu will spread to the West in the weeks to come.
What impact on Precious Metals?
On September 24, 2018, Wall Street began a bear market, which became increasingly brutal until December 25, 2018.
Gold had then followed a completely opposite course.
It started to rise from September 24, 2018 and continued its bull market until February. It was its first wave up.
After 3 months of consolidation, gold went up again in May 2019 until the end of August... while the stock market fell sharply during that period.
Silver had followed exactly the same path as gold.
Falling stocks on Wall Street would therefore most likely be extremely favorable to precious metals.
Given the configuration of gold as silver, the rise could start in the next days to come.
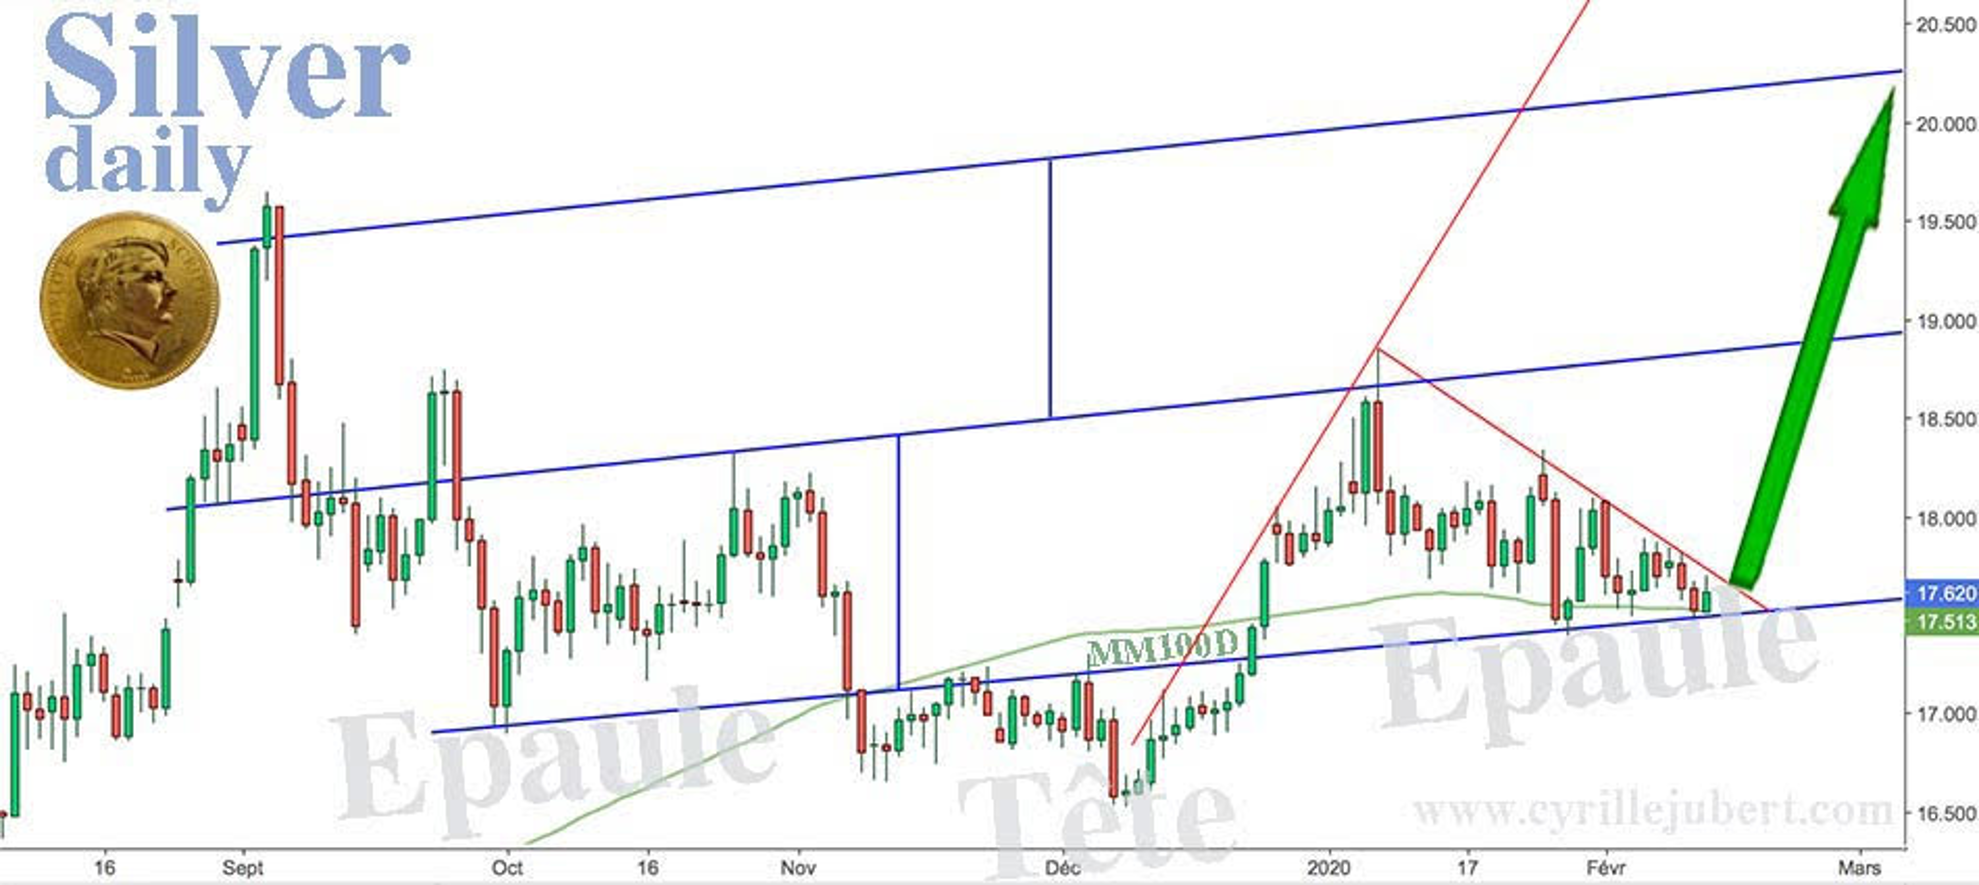
Silver
Since the high point of September 4, silver prices have consolidated by forming a large graphical figure in inverted Shoulder-Head-Shoulder.
On February 13, the courses are supported by a rising oblique support and the MA100D. The bearish slant, which squeezes the prices in the triangle of this right Shoulder, should be broken in the coming days, allowing silver to develop its rising leg, towards the $ 21 Fibonacci’s target.
The resistance, which leaves from the center of the Head, could be touched again on February 28 or March 2 at $ 22.9 if the increase is powerful enough for that.
On the graph below, I have superimposed the dollar prices in green, gold and silver.
On the 3/4 of the graph on the left, we see that a rise in the dollar (green) caused a fall in gold and an even greater fall in silver.
Conversely, a fall in the dollar corresponded to an increase in precious metals. Silver exaggerating the movement of gold back and forth.
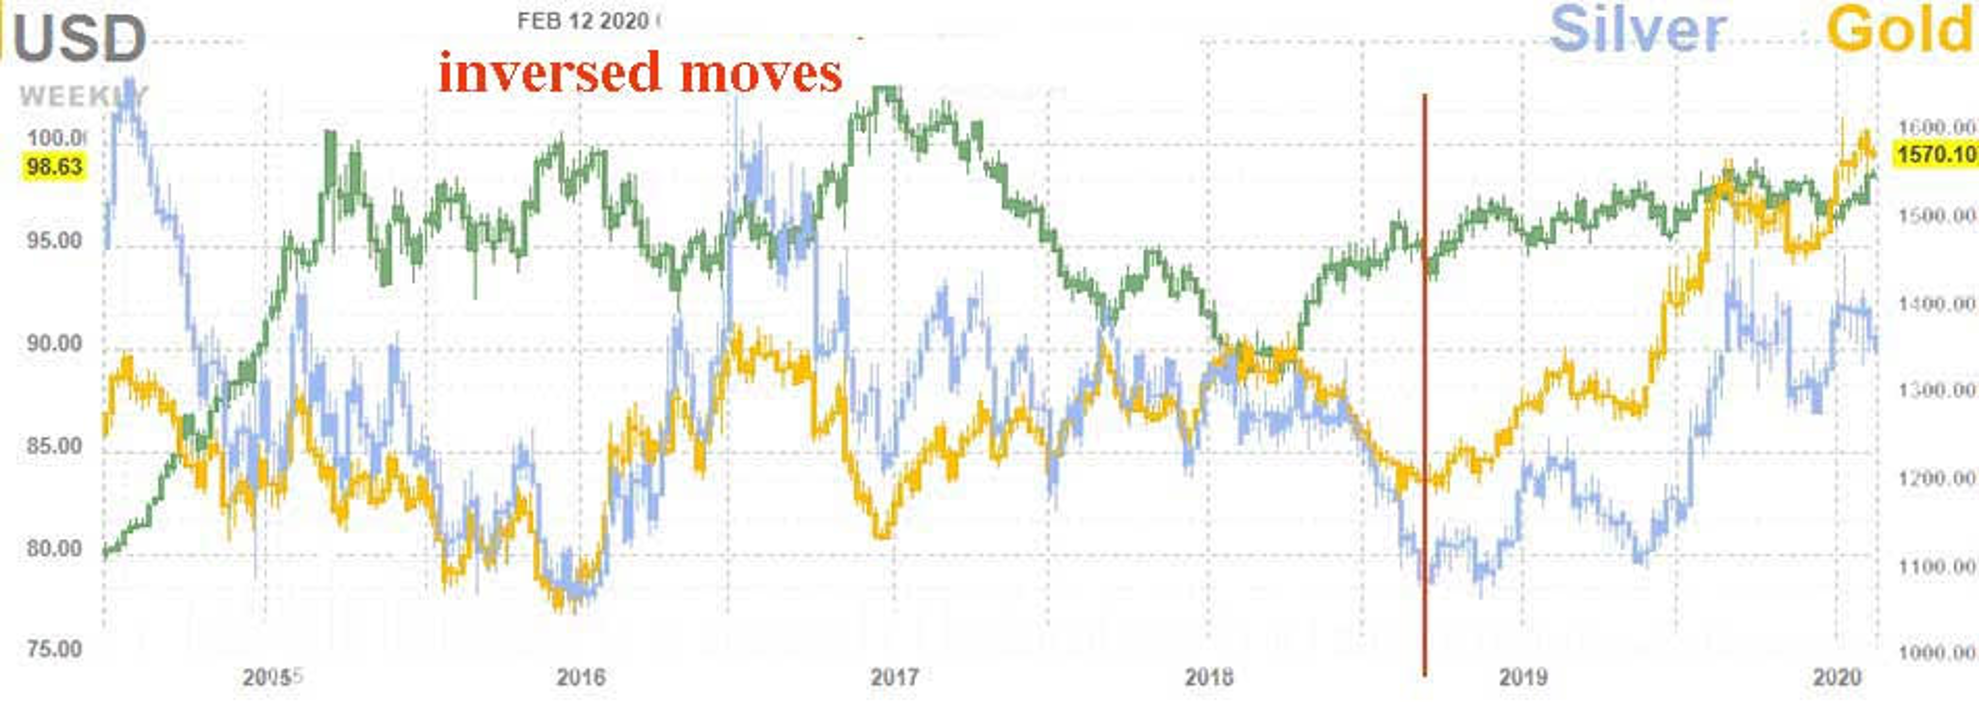
Since September 2018, the dollar has been fluctuating upward in a narrow channel. Gold and silver have their own pace regardless of the movements of the US Dollar index.
Silver, since September 2018, has not yet produced movements exaggerating those of gold. Its course is parallel to gold with a delay.
It therefore lacks a very violent upward movement, so that the silver exceeds the gold, as it always does in the bullish phase.
When the stock market turns lower, capital will flood to silver more than to gold, to take advantage of its greater volatility.
With the Chinese New Year holidays and then with the epidemic, the Chinese mines remained closed. China is the leading producer of gold, the third producer of silver and the largest consumer of both precious metals. China could import more than usual to meet its domestic demand. This is all the more true since the Central Bank has flooded the liquidity market in unprecedented proportions, to prevent companies that cannot meet their financial commitments from leading banks and shadow banking to bankruptcy. The entire Chinese financial system is at risk of a systemic crash.
The more money the Central Bank prints ex-nihilo, the less purchasing power of the currency and the more the price of precious metals will rise.
What is true for the People's Bank of China is also true for the Fed, the ECB and the BoJ, which appear to be competing to devalue their respective currencies.
Gold today registered a new historic high in EUR and JPY.
Graphically, gold could see its price exceed $ 1,789 in March.
Monetary geopolitics
In the very principles of BANCOR, the trade between nations must be balanced. If a country has a trade surplus, the international body in charge of supervising trade will take the decision to revalue the currency of the country upwards in order to make its exports less competitive and/or to devalue the currency of the country in trade deficit, so as to make its products more competitive for export, while reducing its purchasing power.
The subject is totally topical with the "Trade War" between the United States and China, which has been in the news for several months.
China, having itself announced in March 2009, its desire to see the BANCOR of Keynes set up, knows that the solution to resolve the huge imbalance in Sino-American trade is to revalue the yuan and devalue the US dollar. China has prepared for it. While it has been flooding the planet with very low-end consumer products since the 1980s, it has moved upmarket in recent years to offer products that surpass Western products, in terms of quality and technology, such as telephones and computers.
On the other hand, the USA, which has relocated a large majority of its production to Third World countries, has a long way to go to recreate the industrial fabric that has disappeared since the 1980s.
>> Read : Monetary Reform, SDR And BANCOR
Wilbur Ross, former director of Rothschild Bank Inc., current Secretary of Commerce for Donald Trump, and therefore a strategist of the Commercial War, commented on the Chinese epidemic, saying with cynicism: "This will help to accelerate the return of jobs to North America."
We could note that The Economist on its cover published mid-November 2018, announcing the World of 2019, had, by an extraordinary chance, placed this endangered animal, the Pangolin, which the Chinese are fond of. We have learned in recent days that it would have played a decisive role in the mutation of the coronavirus, so that it becomes transmissible to humans.

On January 20, at the Davos Forum, the Bank for International Settlements (BIS) released a report, which sounds the alarm. The increase in the frequency of large-scale climate events will be the source of the next and potentially devastating financial crisis. The “green swan” is a reference to the concept of the “black swan” developed in 2007 by Nassim Taleb, when the American subprime crisis started. What characterizes these "swans" is their rarity and unpredictability by traditional models, but also their disastrous consequences.
Green Swans or Black Swans, 2020 is likely to be an extremely volatile year for all markets.
Reproduction, in whole or in part, is authorized as long as it includes all the text hyperlinks and a link back to the original source.
The information contained in this article is for information purposes only and does not constitute investment advice or a recommendation to buy or sell.


