Precious metals investors have been left scratching their heads since the metals prices made local highs early in the year. Gold has shed more than $1,000 to around $4,200 and Silver has been cut nearly in half since its high of more than $120. In frustrating times like these, it is important to keep in mind the big picture: we remain in a multi-decade bull market; the blowoff phase is still in front of us; and brutal corrections like these are nothing more than the cost of doing business within the precious metals space. But how do we know that the secular bull is not broken? For that, we'll head to the charts.
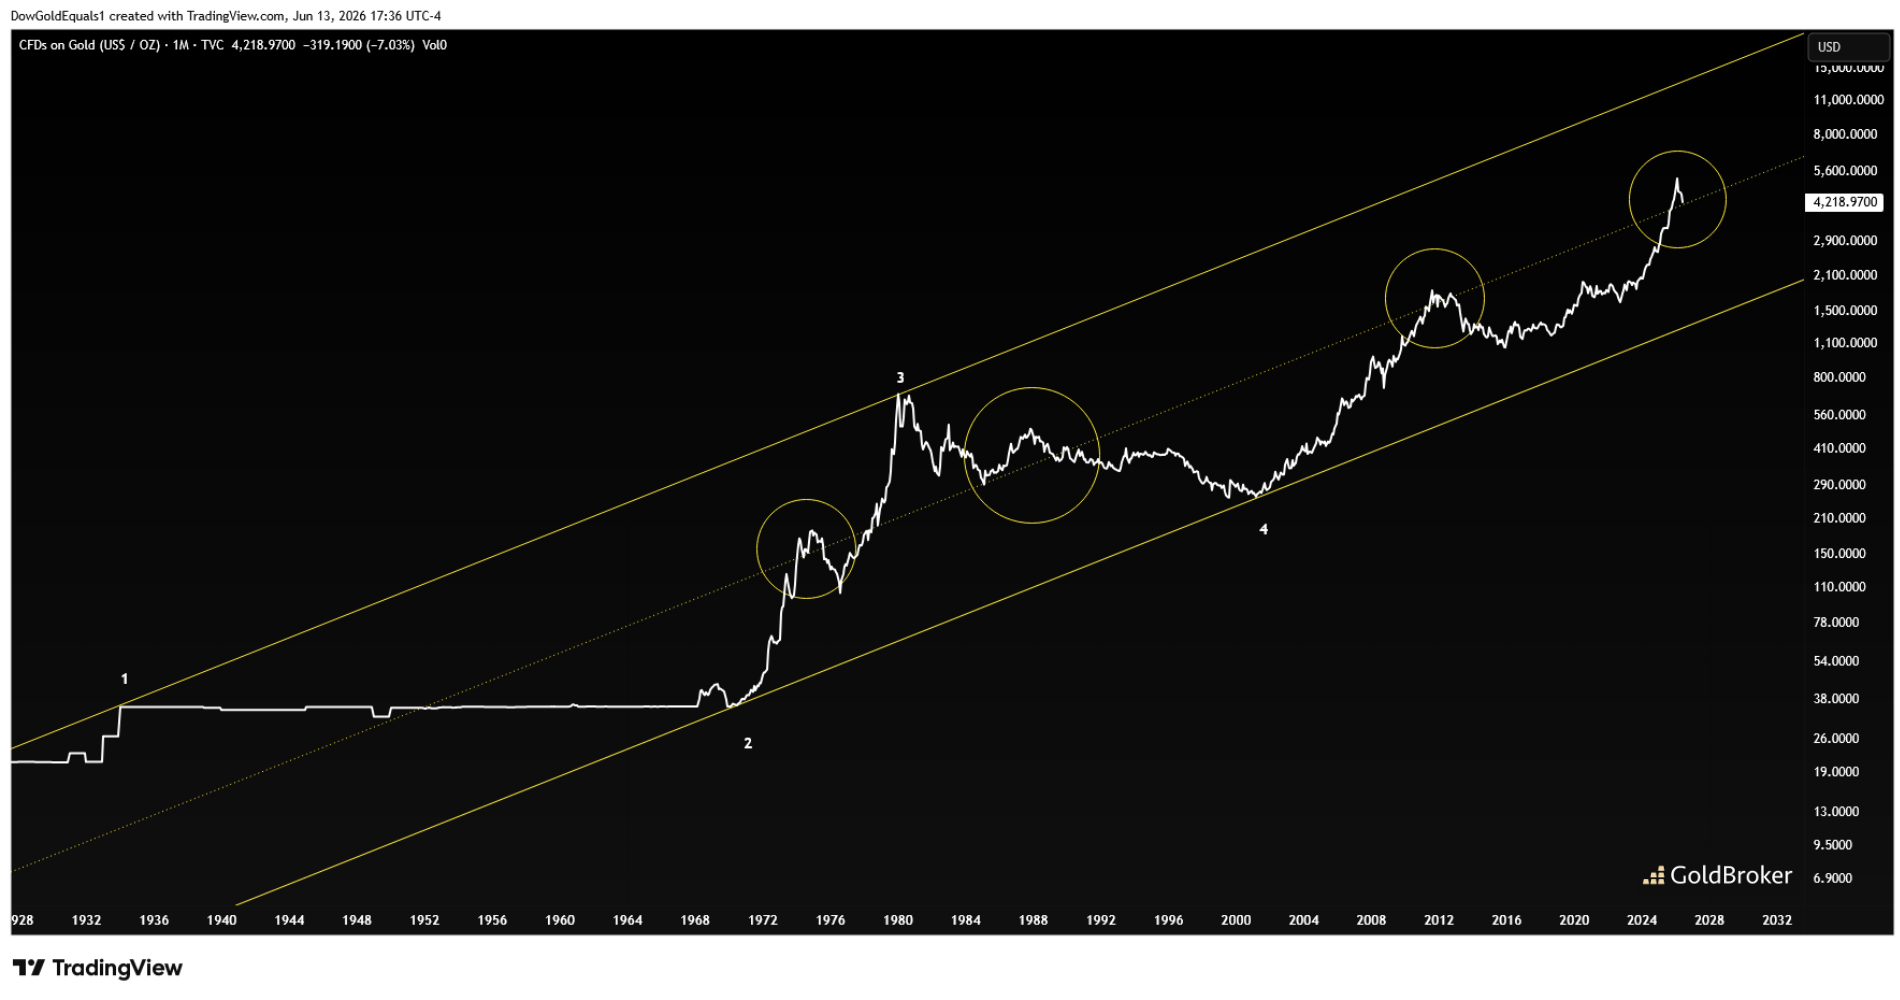
First, we'll look at the historic chart of Gold that I like to define as an elegant 4-point ascending channel. I've said often that price action at a channel's midline can reveal a lot about future price direction, and the Gold chart is a great example of that.
We see here just how important this channel midline has historically been. In 1974, we see that price first broke above the midline and backtested but soon failed, leading to a waterfall decline that saw Gold lose one-third its value. In the 1980s, we see the midline offered a fairly strong supportive bounce from 1985 into 1987 but again a loss of the midline was brutal - this time a secular bear market that lasted into 2001. Then in 2011, the channel midline put an abrupt halt to Gold's decade-long run.
This time around, we see Gold is testing the channel midline from above, which I expect to hold and from there launch its blowoff phase into the ultimate peak of its secular Gold market.
Why am I so sure? For that, we'll turn to Silver.
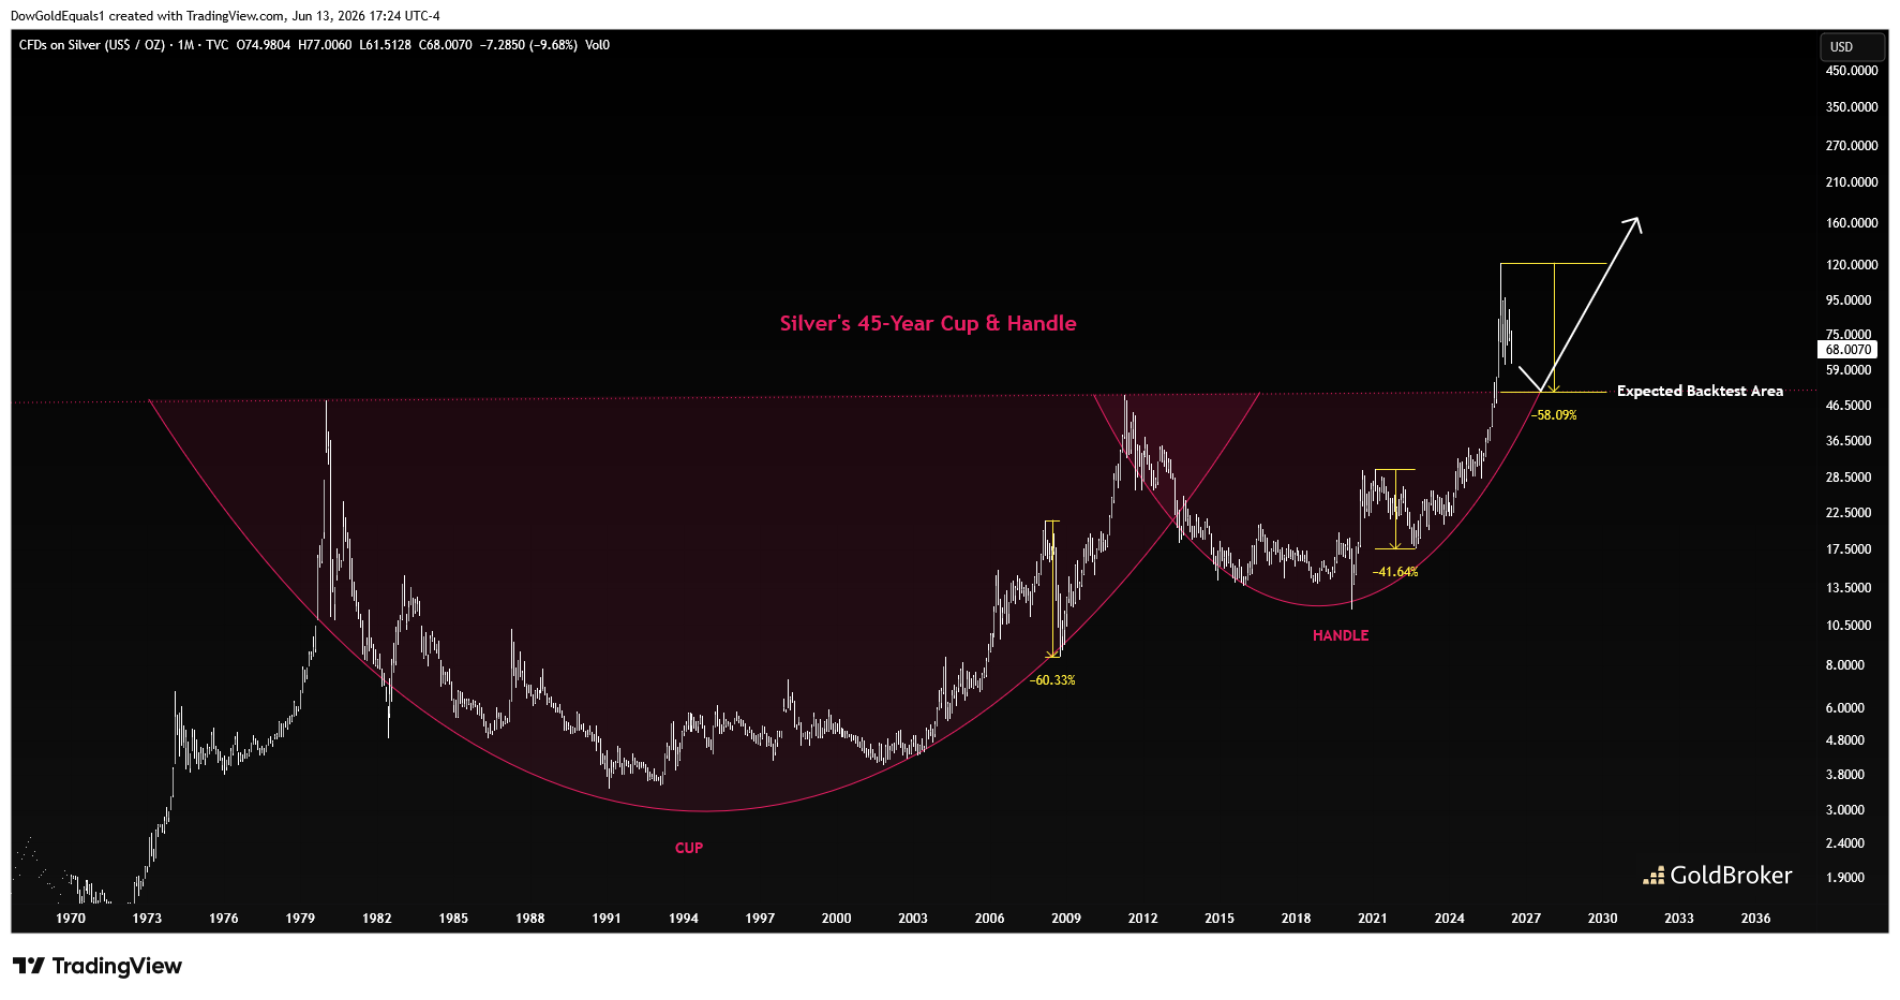
The Silver chart should look familiar to you, as I have routinely shown price defined at a 45-year Cup & Handle pattern that broke out late last year. The impulsive breakout we saw from the $50 level was extremely strong evidence that the pattern is valid, and now a backtest back to the $50 area would provide additional evidence of strong bull market behavior should it hold. I suspect it will, and with price down nearly 60%, many investors will abandon Silver as "left for dead" just before it whipsaws higher and leaves those investors in the dust. We've seen this happen before in 2008 and 2021/2022, which I have marked on the chart. Both times, price then screamed 6-7X higher within just a few years. A similar bounce from $50 will see Silver rise to $300 or more, which has been my base case scenario for some time.
So while I understand the current frustration of many metals holders, continue to keep in mind that these big patterns take time and the biggest gains remain ahead.
Reproduction, in whole or in part, is authorized as long as it includes all the text hyperlinks and a link back to the original source.
The information contained in this article is for information purposes only and does not constitute investment advice or a recommendation to buy or sell.


