Oil has been on a tear this year, near $120 last month, on what most would likely attribute to hostilities in Iran and a battle to control the Strait of Hormuz. While there is no doubt that the geopolitical backdrop has provided fuel for this run (pun intended), my readers also know that current events have served as nothing more than a match to light a fuse that had been set within the price charts long, long ago.
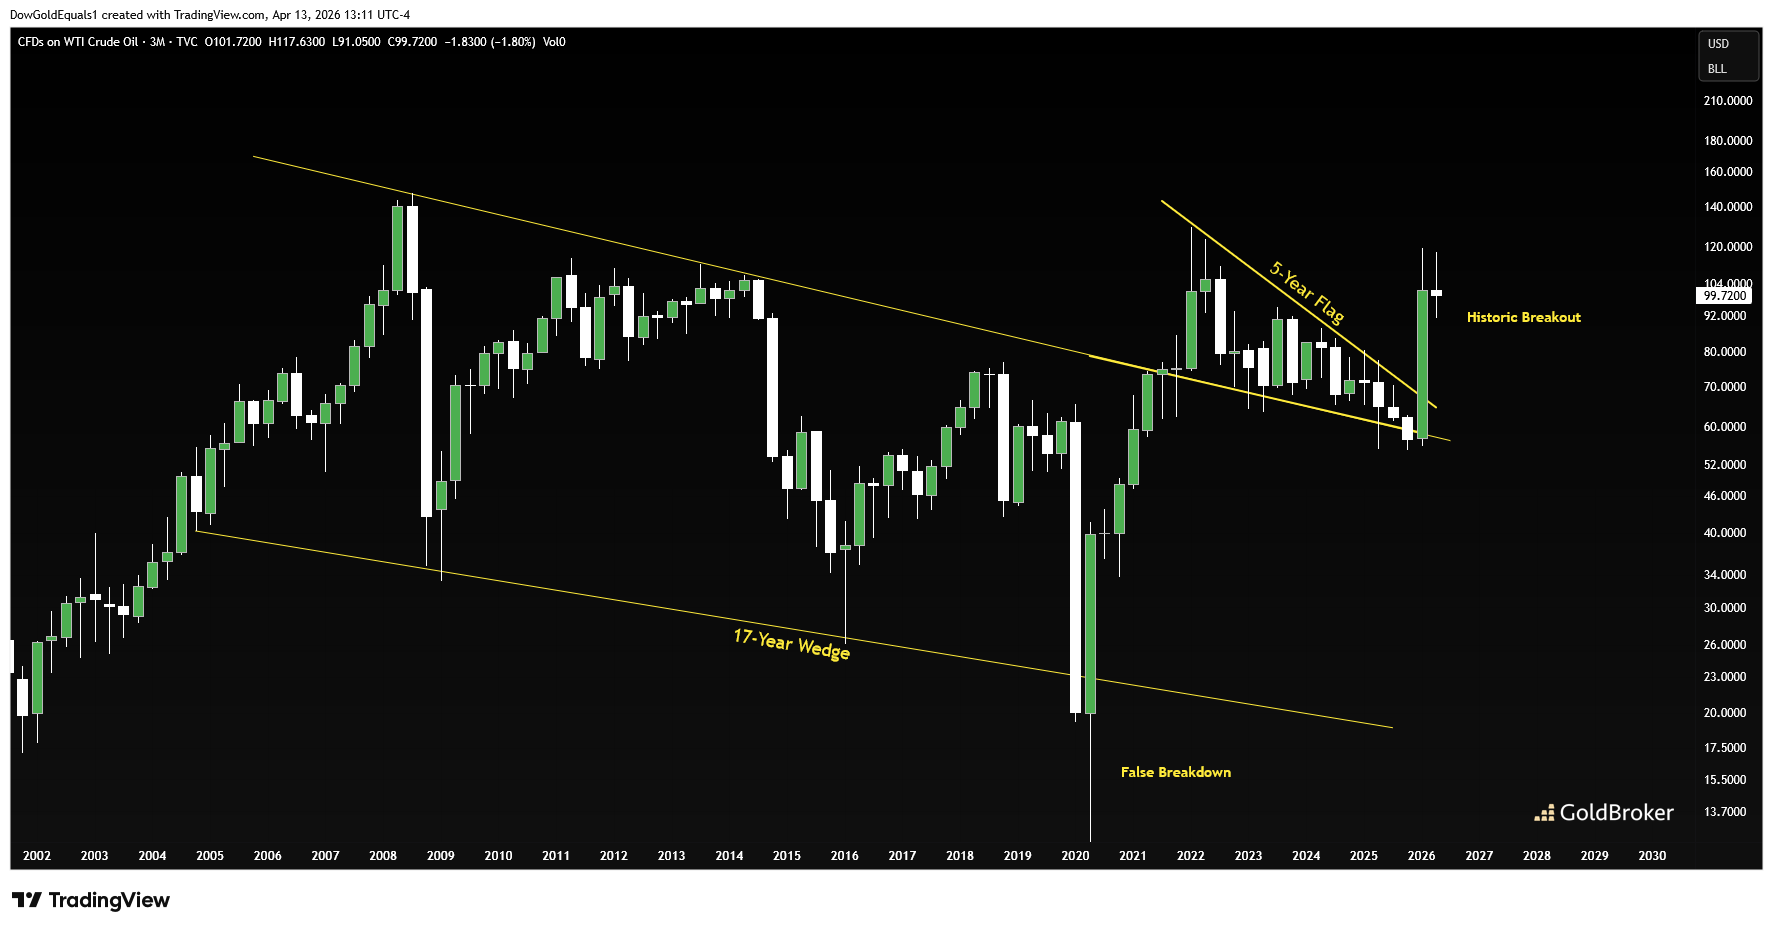
This week, we'll start with a quarterly chart of oil that looks at about the last 25 years of price action. The 17-year wedge is very well defined. After a false breakdown of the oil price during the Covid lows in 2020, my readers know that it then became only a matter of time for an upside wedge breakout. After breaking out of the 17-year wedge, price then formed a very clean 5-year bull flag. Again, as we watched the flag form, we knew again that it was only a matter of time before we would see a big breakout, which we did last quarter. Taken as a whole, oil's price action over the last quarter-century is not a fluke; rather, price has formed incredibly clean technical patterns that have been telegraphing triple-digit prices long before the US began operations against Iran.
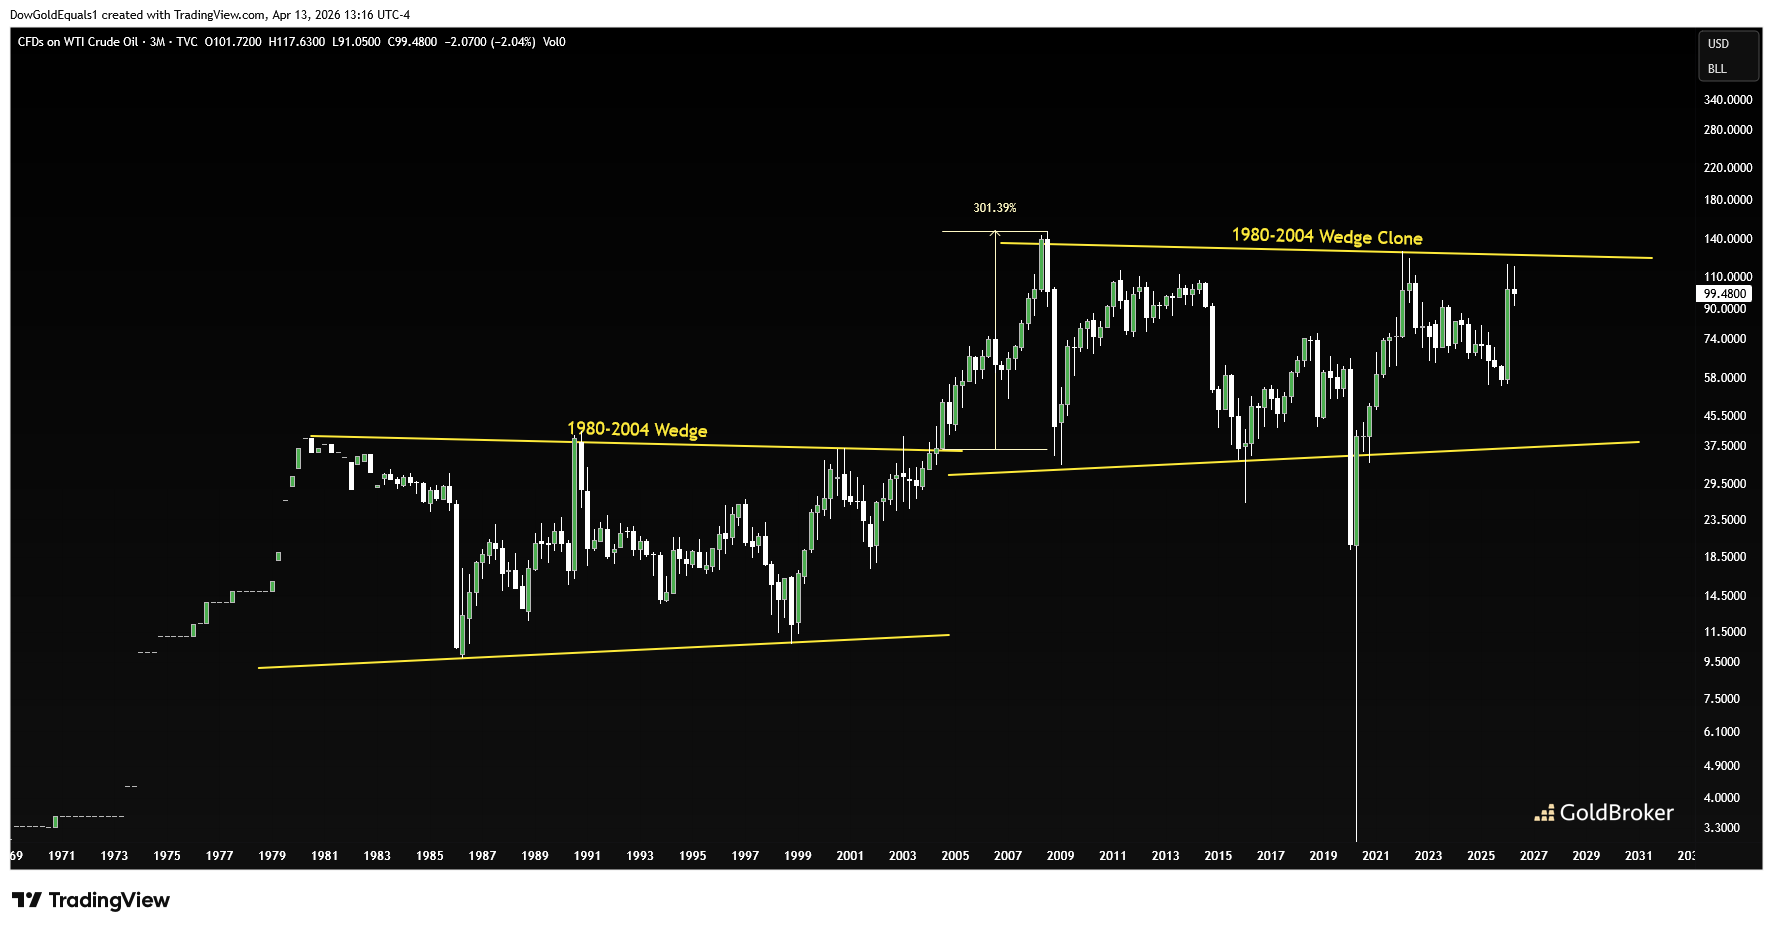
The second chart is a quarterly of oil that looks at the last half-century. It is fascinating how well the 1980-2004 consolidation fits the last 20 years of price action - the key difference being the false breakdown during 2020. When the 1980-2004 wedge finally broke out, oil screamed 300% higher over about 5 years. We may see a similar run when the current wedge finally breaks out.
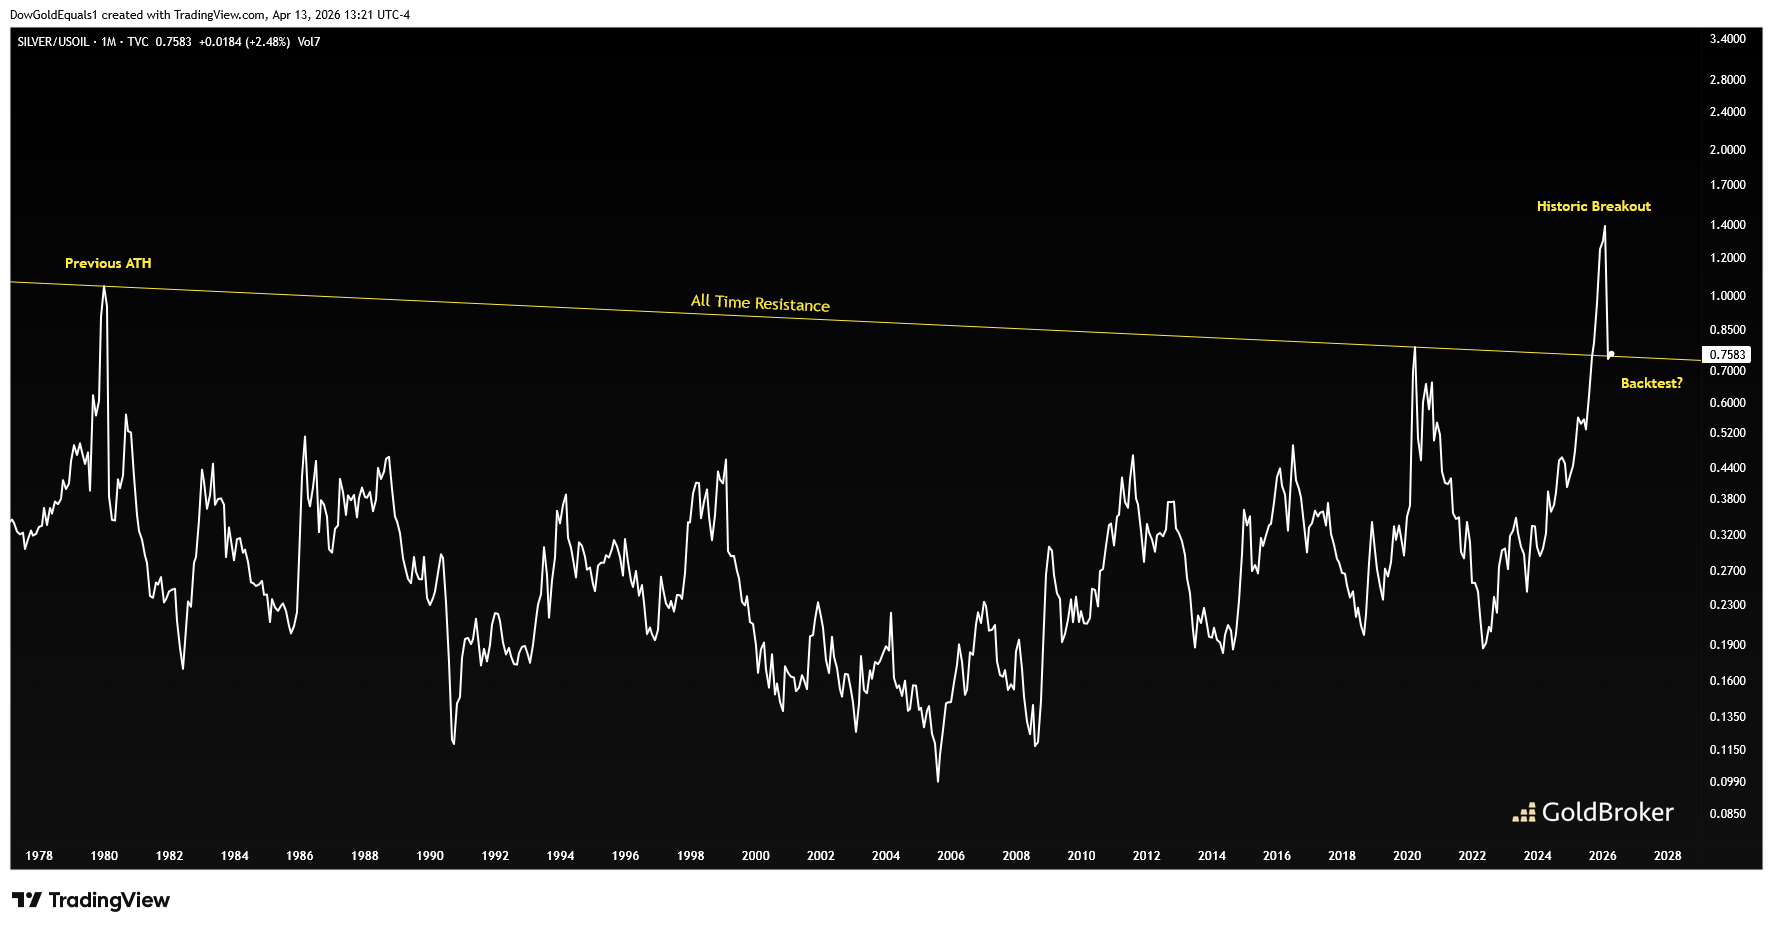
Lastly, we'll look at a long-term chart of the Silver/Oil ratio. After all, we've been calling for much higher silver for a few years, so ideally we would see some evidence that silver could at least keep pace with oil or even outperform. The chart does feature an interesting trendline that connects the all-time high in 1980 to the second highest ratio peak that occured in 2020. We can see that the ratio has recently broken out from that all-time resistance line and is currently backtesting it. Should that backtest hold, we would expect to see silver start outperforming oil going forward.
There seems to be a feeling out there that oil will come back down once US-Iranian hostilities have resolved. The charts say otherwise, and thus the markets might be in for a very big surprise when oil defies everyone's expectations and shoots multiples higher. It will be very interesting to watch how that affects worldwide markets. Stay tuned!
Reproduction, in whole or in part, is authorized as long as it includes all the text hyperlinks and a link back to the original source.
The information contained in this article is for information purposes only and does not constitute investment advice or a recommendation to buy or sell.


