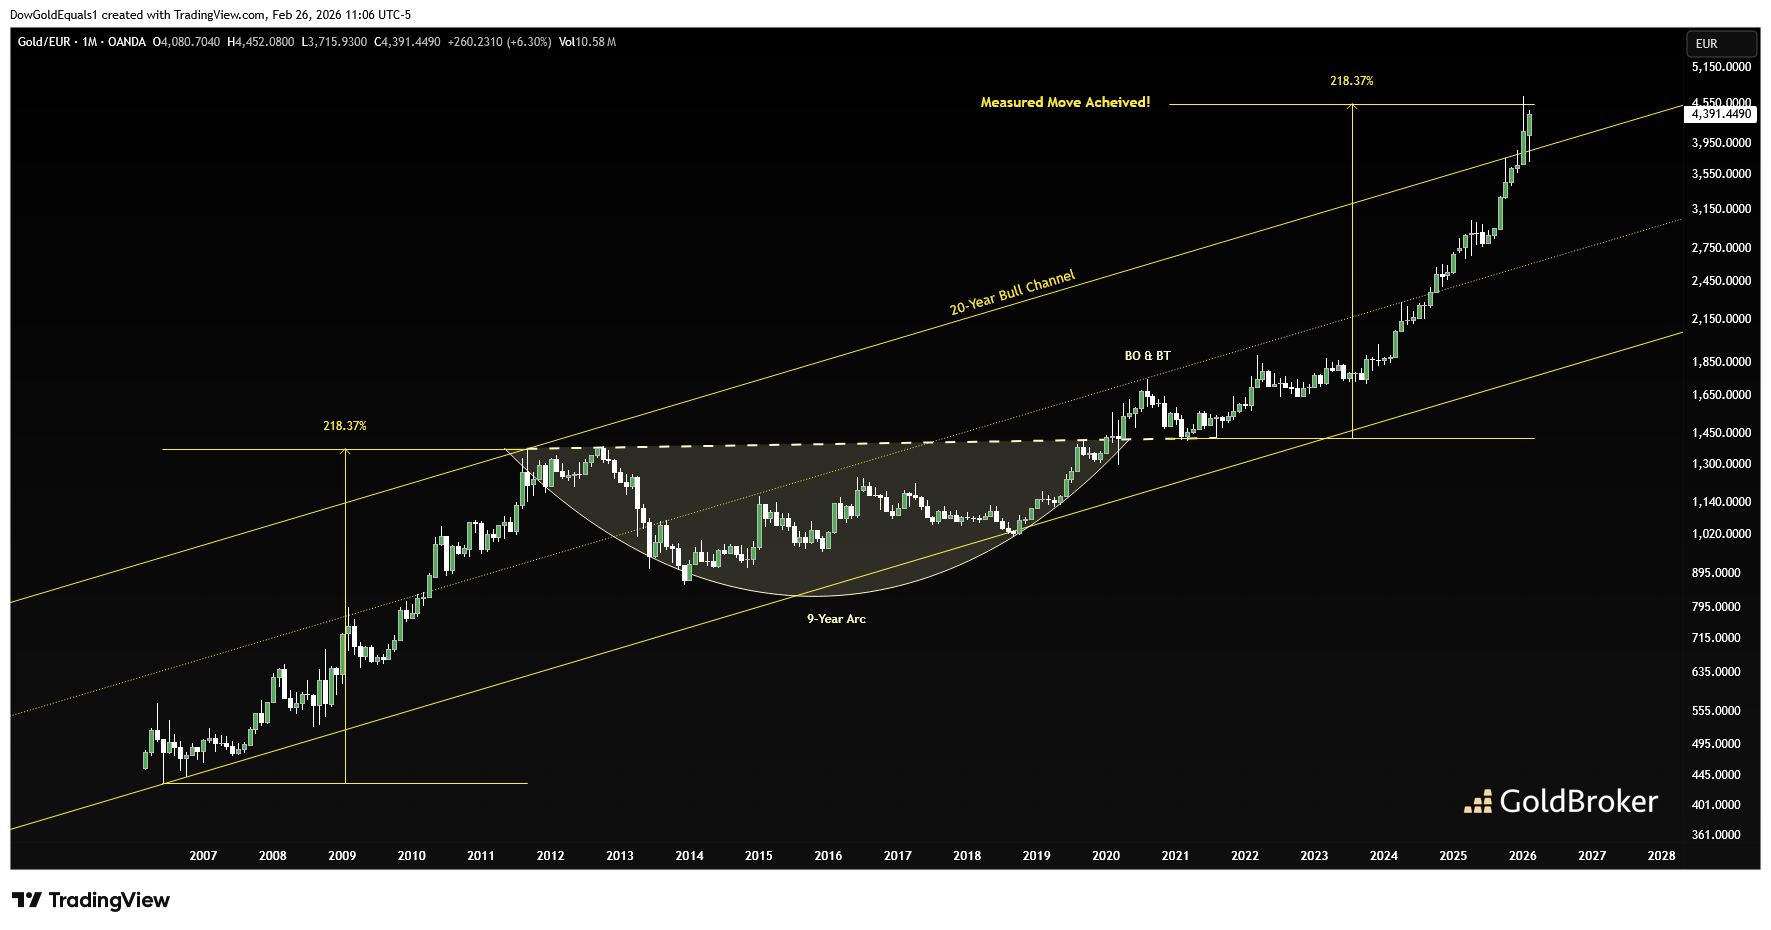
This week we will look at both Gold/Euro and Silver/Euro and see what their similar chart structures might be telling us about the future direction of metals prices. The first is a 20-year chart of Gold/Euro that I have shown you before and have defined as a 20-year bull channel that just recently broke out last month. Here, we can see that price spent the month of February backtesting the channel, and the wick on the monthly candle certainly hints at further upside to come. What I want you to notice from this chart is that price achieved its measured move out of its 9-year arc nearly perfectly prior to this recent channel backtest. I have often said that price charts like symmetry, and an impulse move into a large structure is often reciprocated by an equal impulse move out of that structure.
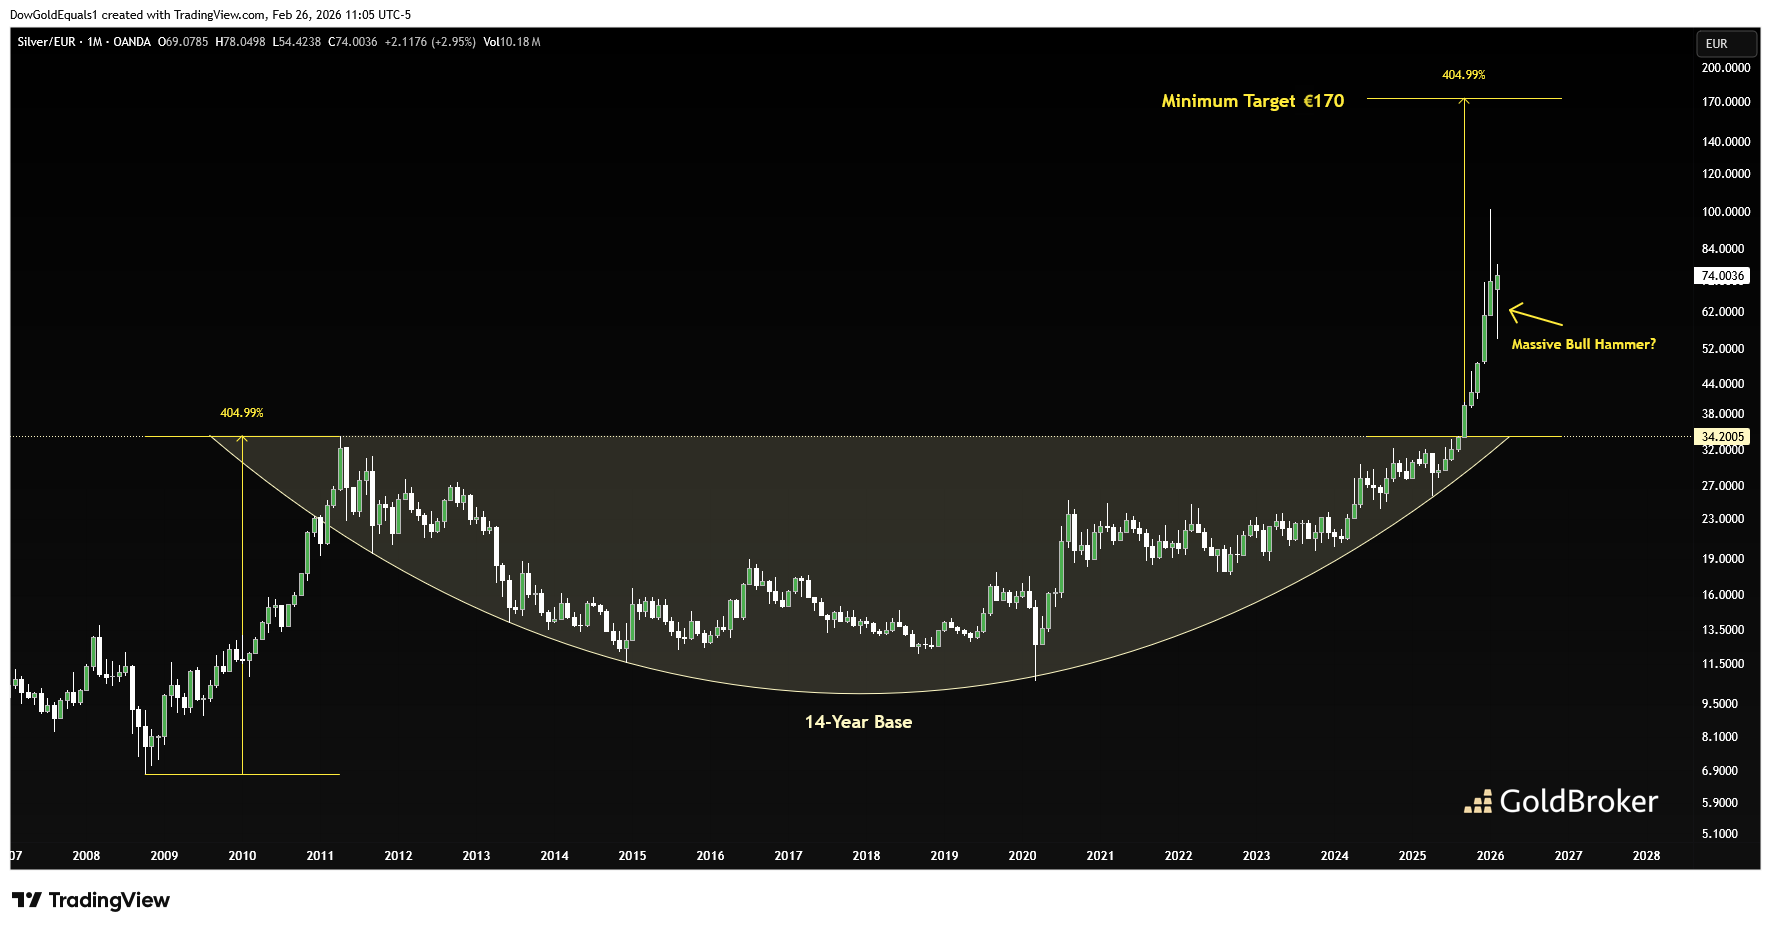
This brings us to the chart of Silver/Euro that looks quite similar to Gold/Euro with an impulse move into a massive arc, this one 14-years, followed by an impulse move out of the arc. Silver/Euro has not yet achieved its measured move, currently about €100 Euros shy of its target. However, this month's candle is shaping up to be a massive bull hammer, which often acts as a springboard for price over the following months. It's a very good set up, and I would not be at all surprised to see price hit my €170 target over the next couple of years.
There are no guarantees in technical analysis, and we must continue to watch how the charts evolve and follow where the evidence takes us. At this time, it appears the metals bull still has a long way to go.
Reproduction, in whole or in part, is authorized as long as it includes all the text hyperlinks and a link back to the original source.
The information contained in this article is for information purposes only and does not constitute investment advice or a recommendation to buy or sell.


