There has been a lot of angst in the silver investing community since the price topped around $120 last month before shedding nearly half its value in a matter of weeks. There is plenty of muscle memory from the euphoric tops and painful drops in 1980 and 2011, leaving some investors downright panicked. This week, we are going to take a closer look at the short term price action and will see that the chart pattern looks pretty familiar to a much more famous bottoming pattern, and thus a lot more comforting.
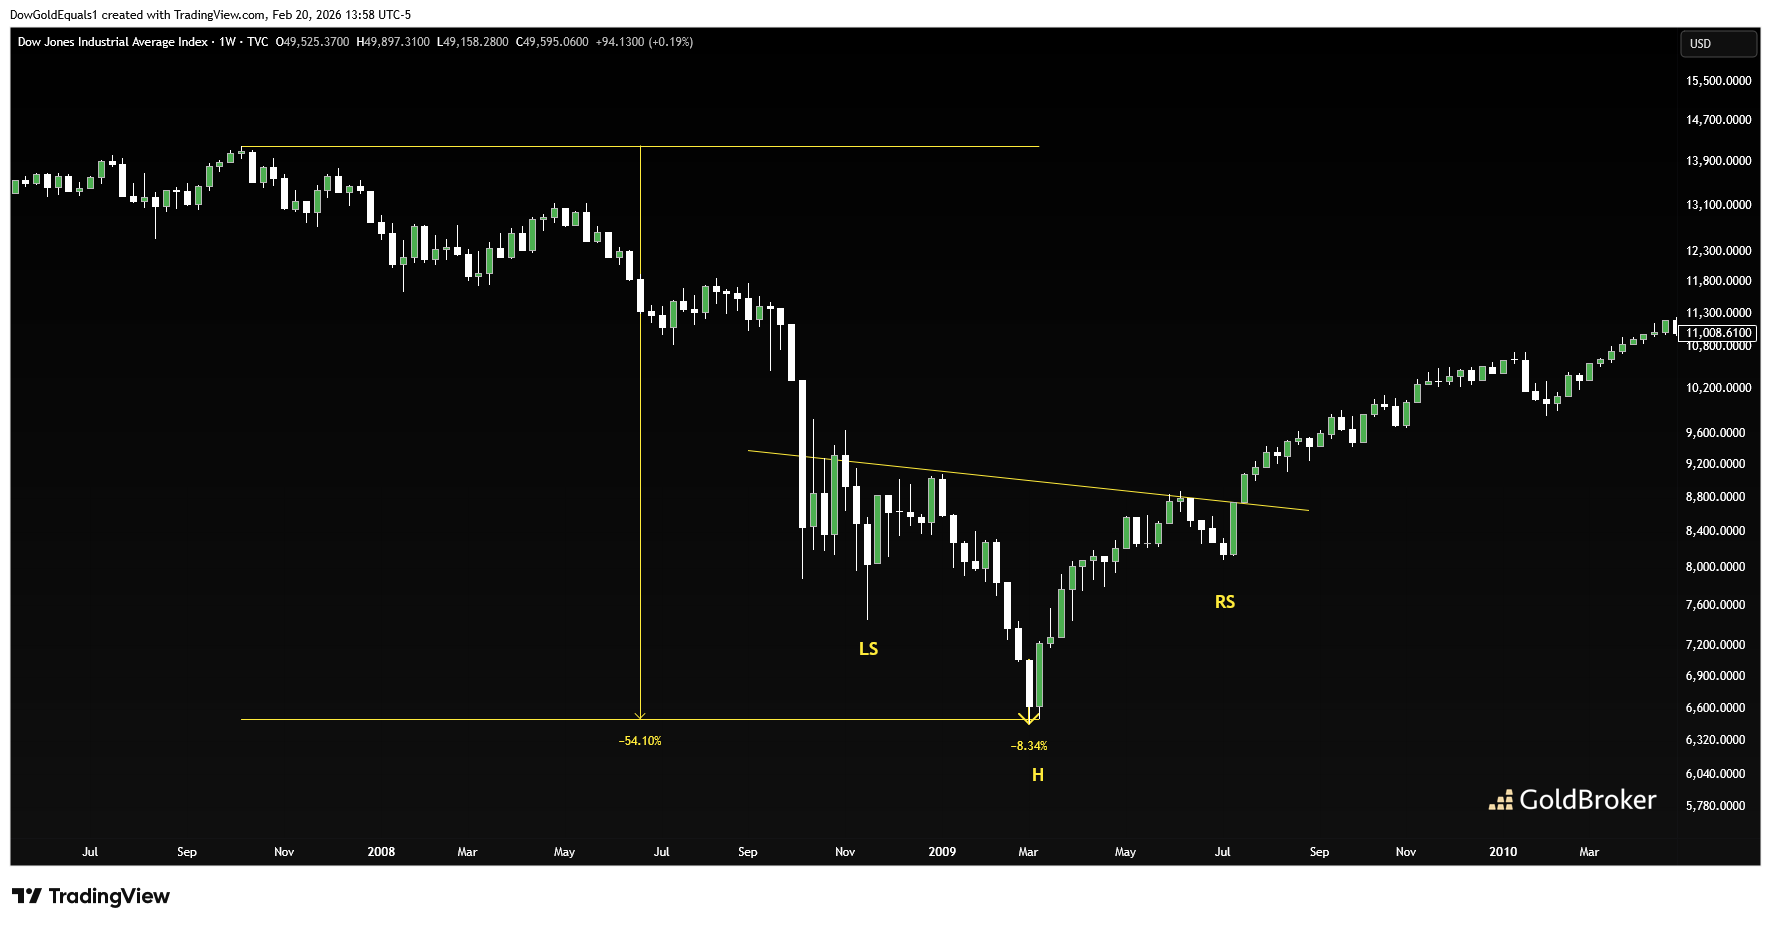
The first chart we will look at is a weekly chart of the Dow Jones Industrial Average during the Global Financial Crisis. Back then, price topped around 14,000 before tumbling more than 50% into 2008, culminating in a nasty 8% single candle drop over a week in March, 2009. We didn't know it then, but March, 2009 was the period of maximum fear and a long term bottom that took the shape of an Inverse Head & Shoulders. From that low, the Dow has increased more than 7X in the years since.
I have always said that chart patterns replicate on time frames large and small, and I think we are now seeing the DJI bottom play out in the 2-hour chart of the silver price. Here, we see a very similar near 50% drop in price, including a 10% single max-fear candle at the bottom earlier this month. From there, we have gone on to form a pretty similar Inverse Head & Shoulder pattern that has recently broken out. Interestingly, both patterns formed a very choppy left shoulder and a much smoother looking right shoulder, and indication that negative volatility has left the market. The patterns are not perfect replicas - they never really are, but this looks close enough to me to conclude silver has turned the corner.
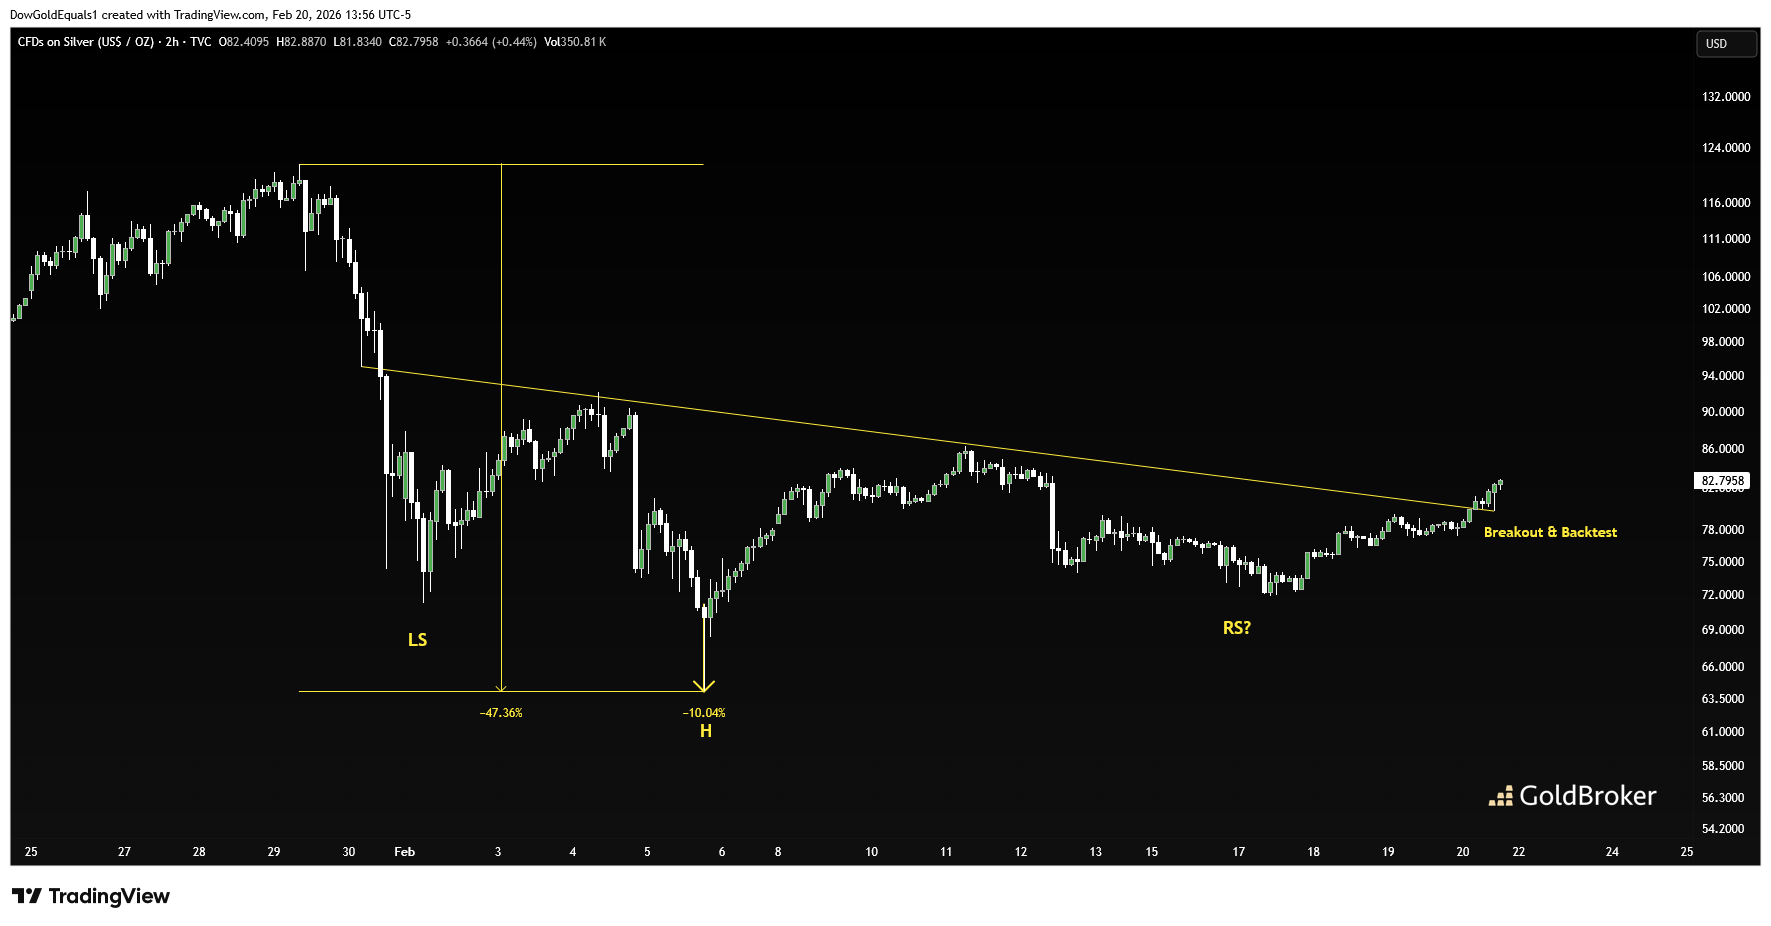
Silver has a little work to do to confirm a major bottom, but it would not surprise me at all to see that silver's correction is now over, and that this Inverse Head & Shoulder bottoming pattern could send price back over $100 and well beyond.
Reproduction, in whole or in part, is authorized as long as it includes all the text hyperlinks and a link back to the original source.
The information contained in this article is for information purposes only and does not constitute investment advice or a recommendation to buy or sell.


