Last week, we looked at a couple of charts that suggested the current pullback in precious metals may have another leg down before we can begin looking higher. We're in a vicious pullback that is sure to test the resolve of even the most hardened metals bulls. This week, we'll take a broader look at three ratio charts that must go the way of the bulls if the metals are to see that next leg higher.
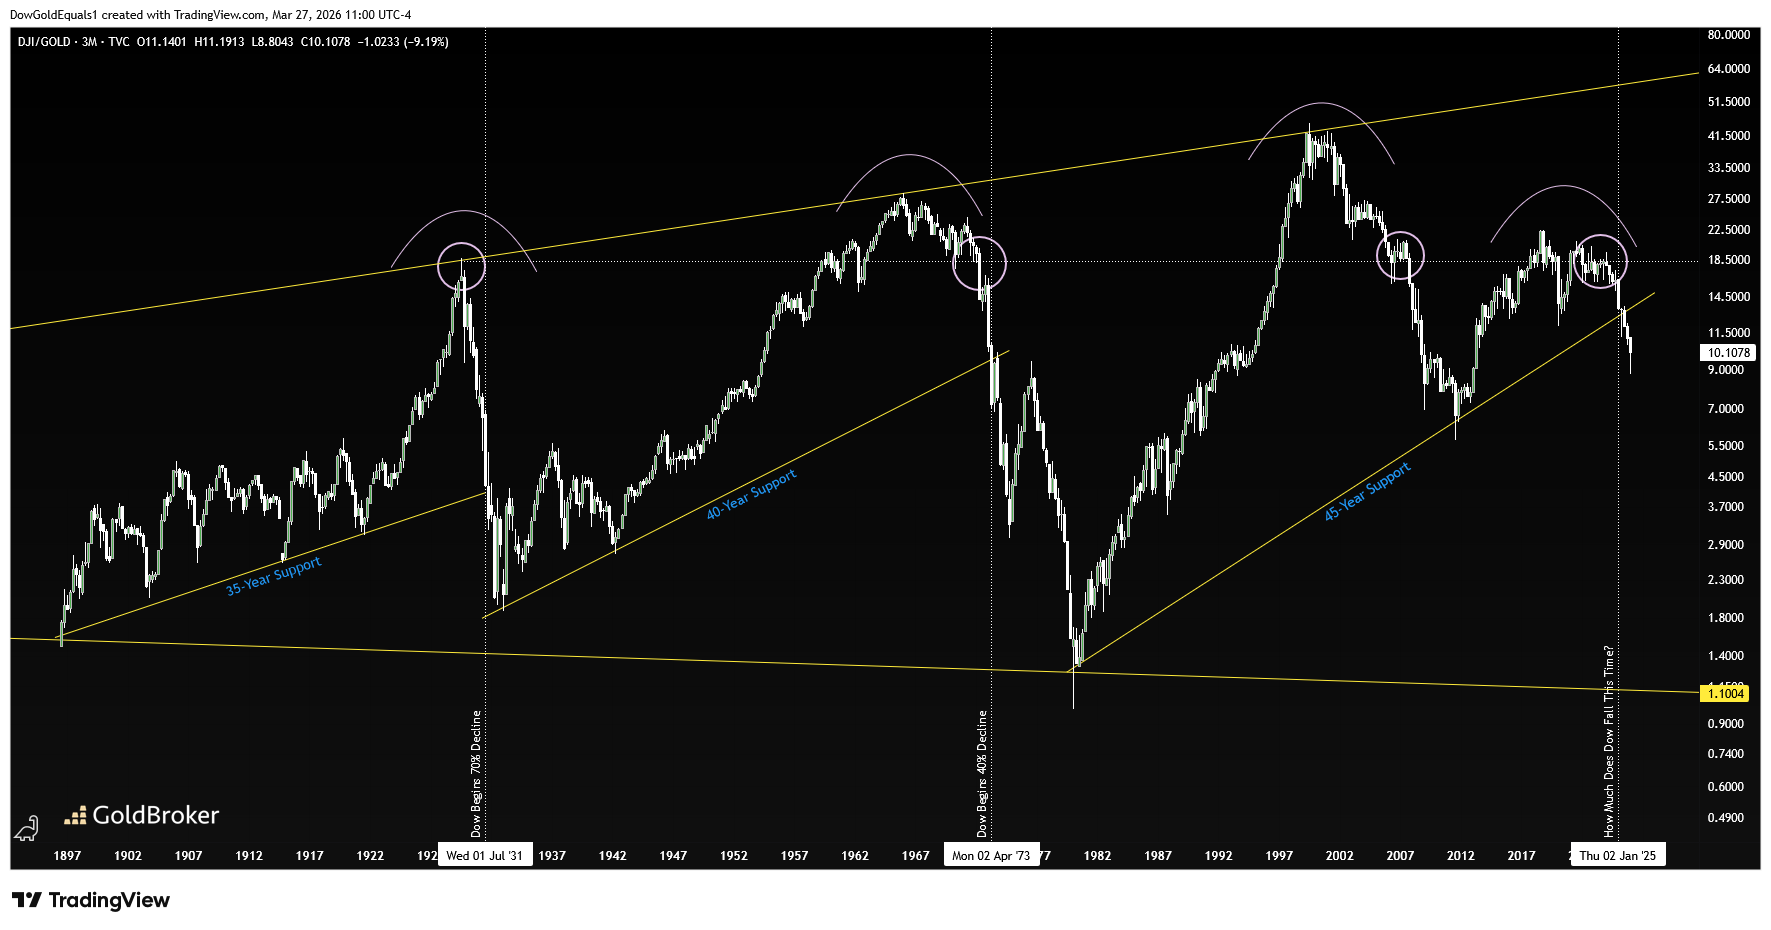
The first chart is a ratio of the Dow Jones Industrial Average to gold and is indeed the most promising. The 100-year chart shows a clear pattern of big secular runs higher in the ratio before transitioning into waterfall declines that break multi-decade support. These waterfall declines have accompanied very big bull markets in gold with the 1970s bull being most notable. The ratio just broke down from 45-year support last year, a strong signal that the secular bull run in gold that began in 2001 had an impulsive multi-year run ahead of it. Based solely on this chart, the recent pullback in gold prices would appear to be nothing more than a minor setback before a blowoff top to come in the years ahead.
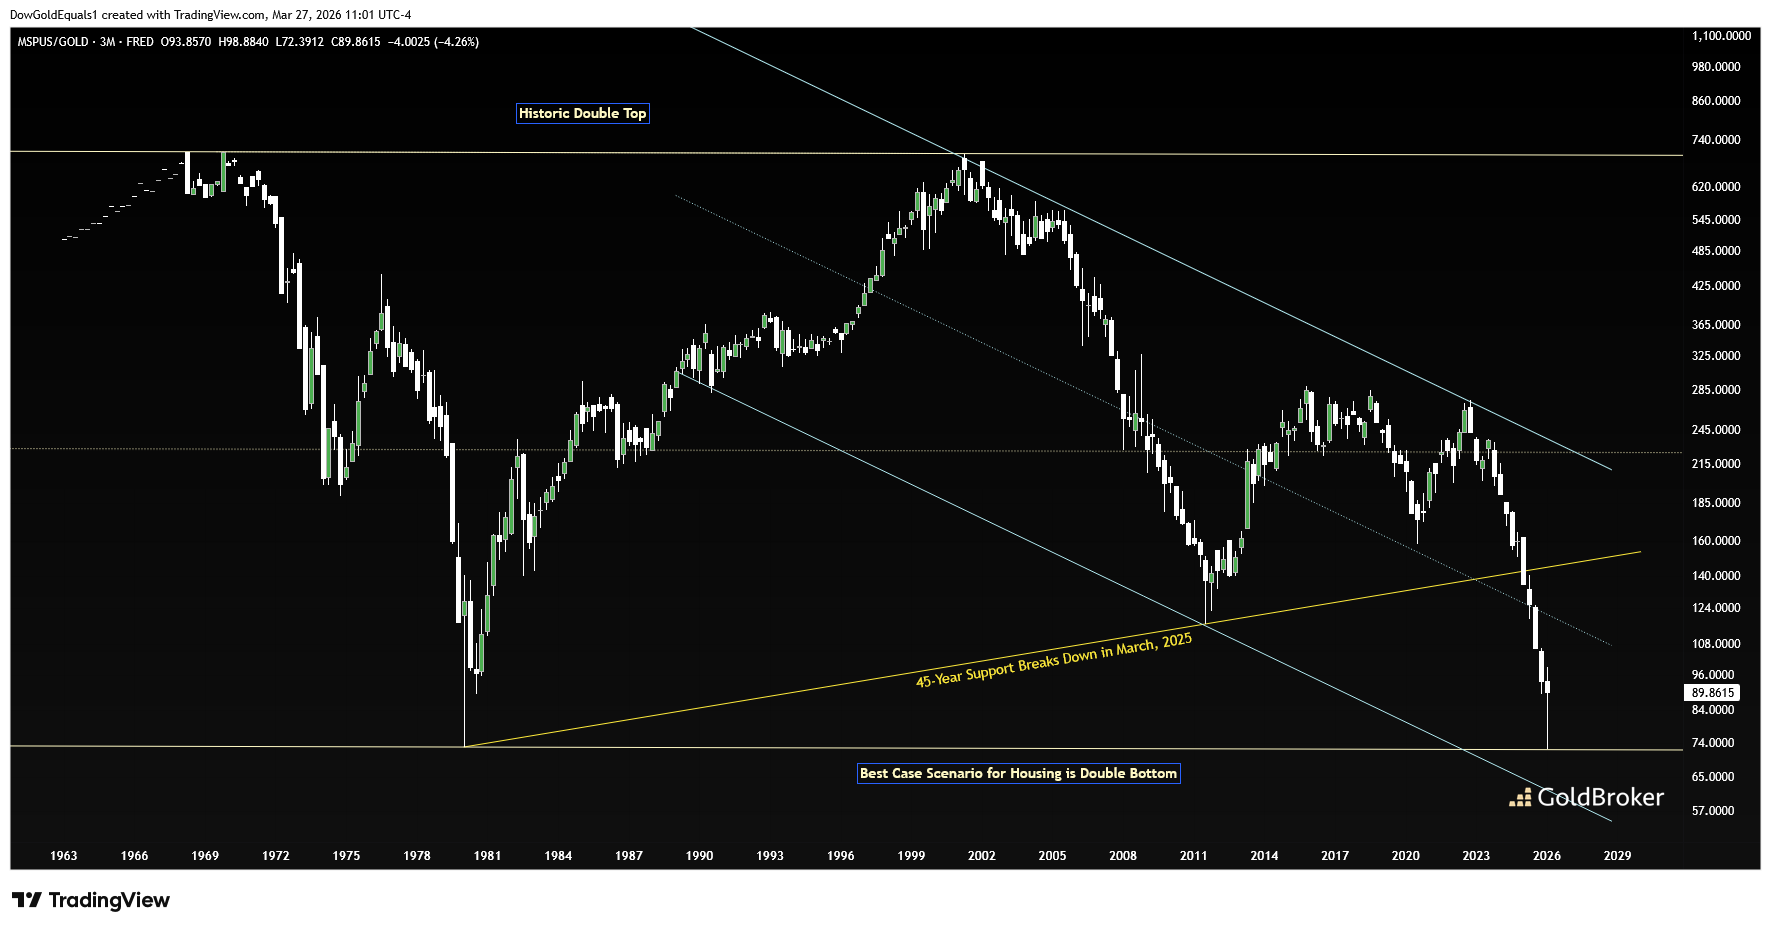
The second chart is a ratio of the median home price in the United States to gold, in which it is abundantly clear that a declining ratio has accompanied historic gold bull markets. Most recently, the ratio bounced hard off the 1980 historic low level, signaling a potential double bottom is trying to form. Should that happen, a rising ratio would be a strong headwind against gold's further gains. For gold to surge further from here, we would actually want to see the double bottom negated and the broad channel in which I have defined this chart to eventually breakdown and seek new all time low.
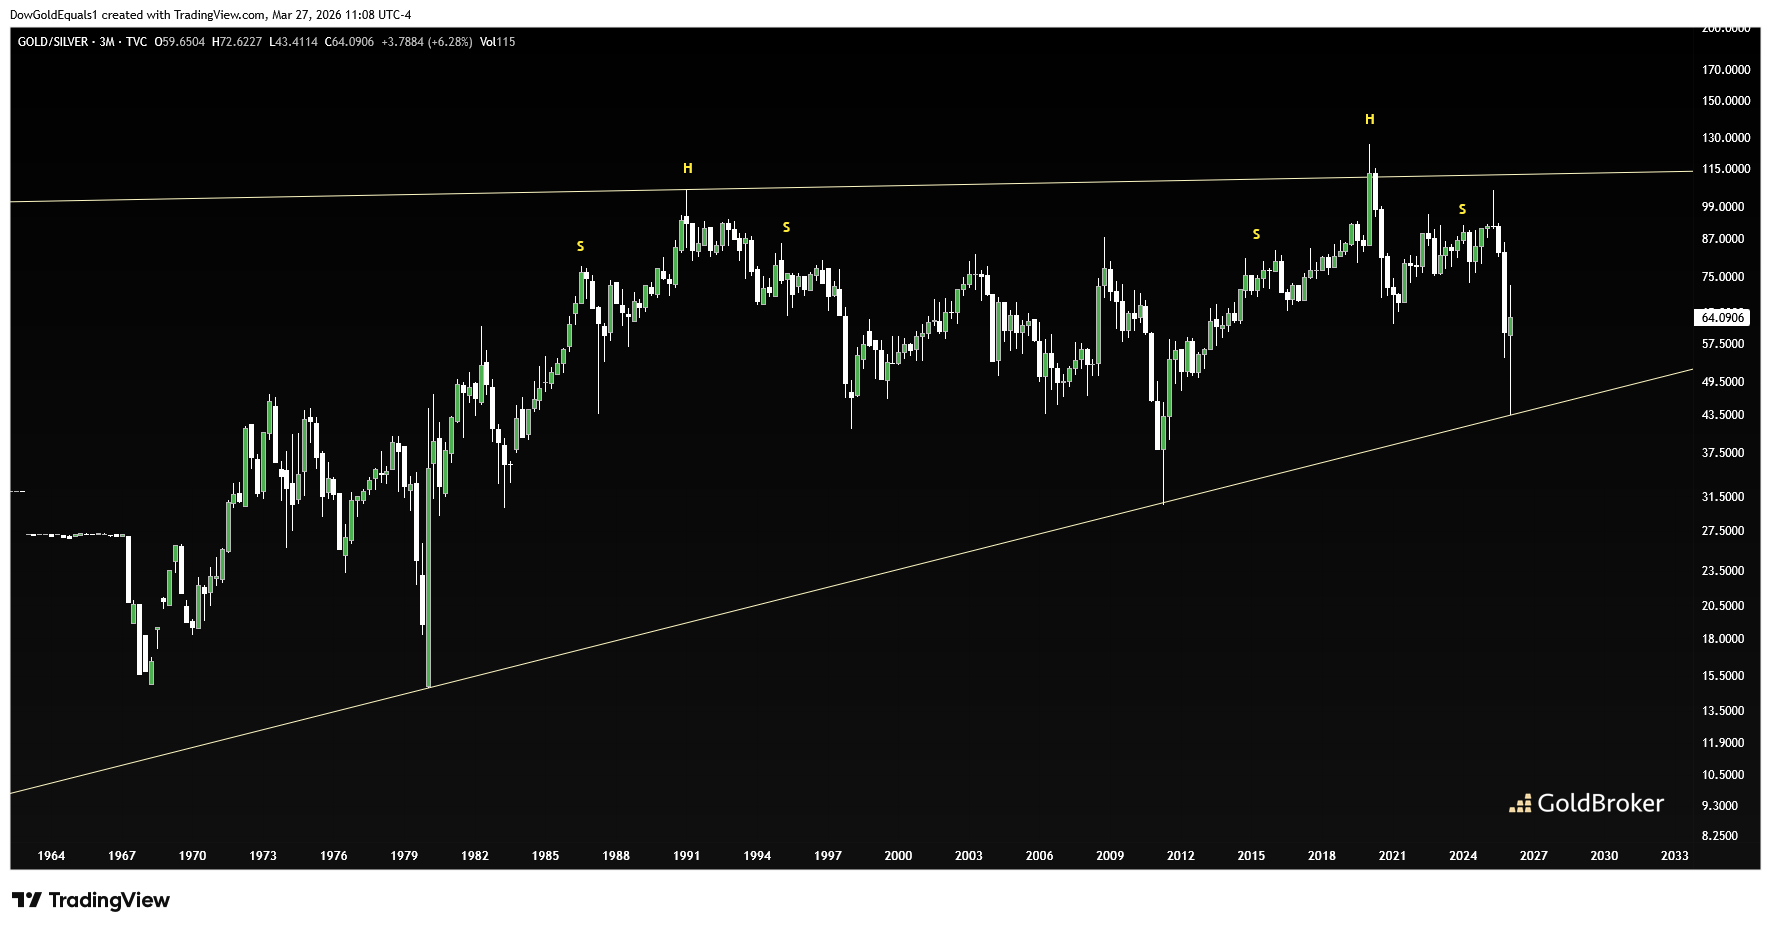
The third chart is a ratio of gold to silver, which I have defined as a large rising wedge. Most recently, the ratio has bounced hard off the lower rail that connects 1980 and 2011, the years of historic tops in the metals. Obviously, metals bulls would not want to see that lower rail hold and signal a third historic top. Rather, the ratio needs to reverse strongly from here and breakdown from the lower rail. A breakdown would be the strongest signal yet that the metals bull market will be making significantly higher highs from here.
Reproduction, in whole or in part, is authorized as long as it includes all the text hyperlinks and a link back to the original source.
The information contained in this article is for information purposes only and does not constitute investment advice or a recommendation to buy or sell.


