Beyond the stockpiles of enriched uranium and the number of missiles launched by each side, the war against Iran also has a crucial financial dimension that deserves close examination.
Oil, “Black Gold”
Since 1973, the petrodollar system has required oil-producing countries — particularly OPEC members — to sell their oil in US dollars. This mechanism simultaneously compelled importing nations to maintain dollar reserves and, in turn, recycle those dollars into US Treasury securities.
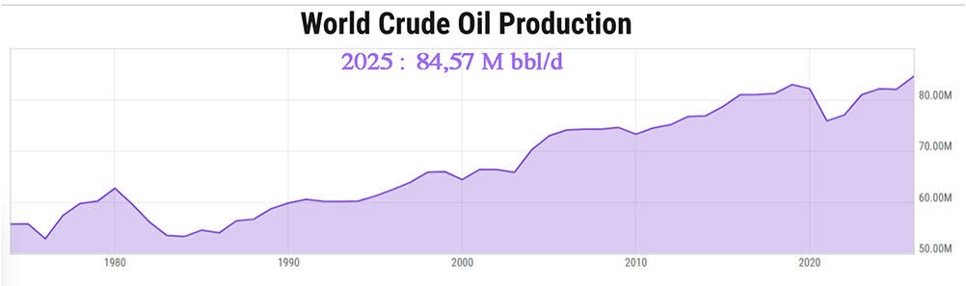
To illustrate the scale involved, global oil production reached approximately 60 million barrels per day in 1980, at a price close to $30 per barrel. This represented a financial flow of roughly $1.8 billion per day, or nearly $657 billion annually, excluding natural-gas revenues.
For perspective, in 1980 the US M2 money supply stood at approximately $1.599 trillion, while federal debt still amounted to only $964 billion.
By 2025, global production had climbed to 84.5 million barrels per day, at an average price of $80 per barrel, generating an annual market volume of nearly $2.467 trillion.
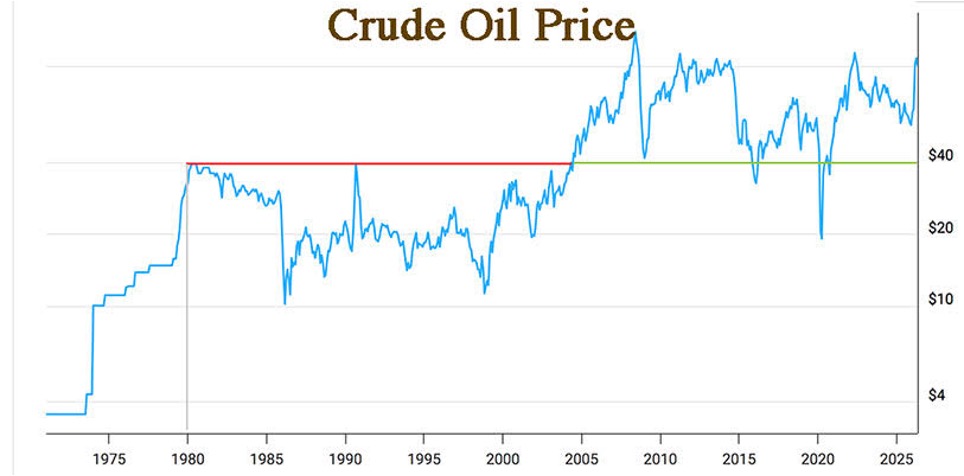
From the mid-1970s onward, producing nations accumulated vast reserves of dollar liquidity, which they also had a strong incentive to invest in Treasury bonds and other US assets. Oil production thus became not only a generator of wealth but also, indirectly, a creator of dollar-denominated monetary expansion.
Demand from producing countries, combined with that of consuming nations, helps explain both how the United States continued finding buyers for its $39 trillion debt and why the New York Stock Exchange has experienced near-continuous growth since 1973.
It also helps explain why the United States marginalized countries such as Saddam Hussein’s Iraq, Gaddafi’s Libya, and Iran when they explored the possibility of selling oil in alternative currencies. Such a shift would have challenged the underlying architecture of the petrodollar system.
It is noteworthy that The Economist was already discussing, in November 1988, the possible emergence — around 2018— of a new monetary system in which gold would play a central role. According to this perspective, fiat currencies were expected to undergo severe depreciation driven by hyperinflation, gradually pushing governments and populations toward a monetary standard perceived as more stable.
The price of gold
Since 1971, the price of gold has risen from approximately $42 to $5,000 per ounce, representing an increase of nearly 120-fold.
In practical terms, this implies that the purchasing power of the dollar has declined by roughly the same magnitude.
When the petrodollar agreements were negotiated in 1973, oil traded at approximately $4.30 per barrel.
Applying the same 120-fold multiplier, oil would now be valued at roughly $500 per barrel.
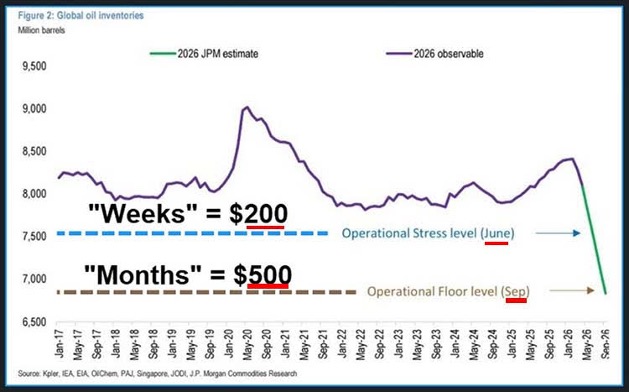
According to JPMorgan, this is precisely the level oil could reach by September 2026 if tanker traffic through the Strait of Hormuz fails to normalize rapidly — although, at this stage, such a scenario does not appear to be the most probable.
In the same communication to clients, JPMorgan reportedly estimated that oil could rise to $200 per barrel as early as June, in other words, within a matter of weeks.
The war against Iran has profoundly disrupted oil and gas flows from the Persian Gulf.
Yet the strategic reserves of importing countries are not unlimited. At the same time, inventories of refined products — diesel, kerosene, and industrial fuels — are already approaching critically low levels, including in the United States.
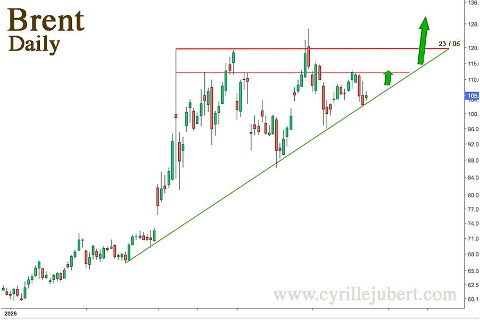
Applying the Wolf Wave method over the same analytical period used by JPMorgan likewise produces a projection pointing toward $200 oil in the coming weeks.
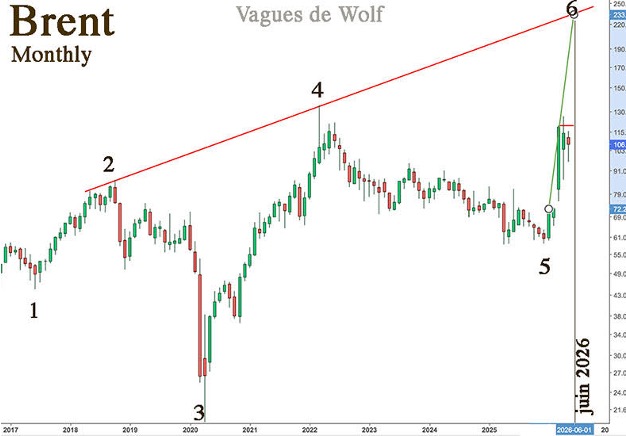
Regardless of the precise figure, the broader trend appears clear: oil prices are positioned for a significant upward move.
Once the $120 resistance level is decisively broken, the increase could become particularly violent, much as it did at the onset of the conflict, when prices surged from $70 to $120 in just seven days. From a technical standpoint, an initial target would lie near $152.
What appears certain, however, is that the higher energy prices climb, the more consumption is likely to slow — both among households and across industrial sectors.
Rising energy costs therefore risk producing a dual shock: a marked economic slowdown combined with accelerating inflation in the months ahead.
Should diesel shortages worsen to the point of disrupting transportation networks, broader economic activity could become severely impaired.
The whole system could then grind to a halt.
The drying up of the petrodollar flow
Furthermore, Gulf countries, deprived for several months of their normal oil and gas production and export capacity, are no longer generating the massive revenue flows that traditionally found their way into sovereign debt markets and US financial assets.
Nearly one billion barrels have already been lost. As a result, this financial recycling mechanism has been — at least temporarily — disrupted.
This dynamic helps explain some of the current tensions affecting credit and real-estate markets in Japan, the United Kingdom, and the United States.
Interest rates, in particular, are rising as money flows from the energy sector slow. In the absence of sufficient demand, governments and monetary authorities must offer higher yields to attract capital.
According to this chart, the 30-year US Treasury yields could therefore move toward 5.50%.
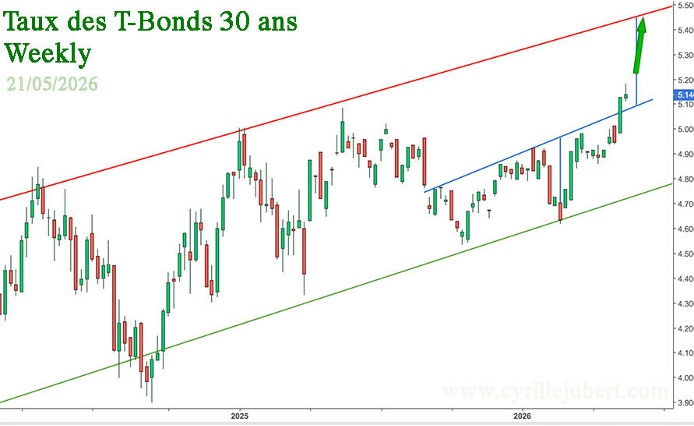
However, the higher interest rates climb, the more the market value of existing bonds declines.
This creates a substantial risk for the banking sector, given that a significant share of bank capital is composed of government bonds acquired at valuations far above their current market price.
Towards a stock market correction… then a reset?
In my view, this critical combination — constrained oil flows, surging energy prices, and the drying up of financial recycling mechanisms — could trigger a sharp stock-market correction in the coming weeks.
Such a shock could initially drive precious metals sharply lower, potentially toward their 15-month moving averages — approximately $4,010 for gold and $56 for silver.
Despite ongoing tensions in the physical market, a sufficiently large wave of selling in ETFs such as SLV or GLD could still push prices downward.
The Jane Street episode offers a recent illustration: after becoming one of SLV’s principal shareholders during the final quarter of 2025, the firm reportedly sold a significant portion of its holdings, contributing to a decline in silver prices. The mechanism itself is relatively straightforward to reproduce.
However, if a genuine stock-market crash were to unfold, the Federal Reserve could ultimately be compelled to inject another massive wave of liquidity in order to stabilize banks, pension funds, and financial markets.
Such monetary expansion would likely propel precious metals toward new historic highs.
Nor should we forget that Trump himself openly alluded to the coming “Reset.”
In this framework, the so-called Reset would amount to little more than an accounting adjustment on the Federal Reserve’s balance sheet, as discussed in certain documents published by the Fed in 2025.

The question now increasingly being asked is therefore straightforward: at what price would gold be officially revalued by presidential decree?
The wildest bets are now on the table.
What appears more broadly anticipated, however, is the possibility of a rapid — and potentially violent — acceleration in precious-metal prices in the short term.
Reproduction, in whole or in part, is authorized as long as it includes all the text hyperlinks and a link back to the original source.
The information contained in this article is for information purposes only and does not constitute investment advice or a recommendation to buy or sell.


