For several days now, the oil market has been behaving as if the crisis in the Strait of Hormuz were already a thing of the past. Brent prices have corrected, short positions have reached record highs, and the consensus is now that energy flows from the Gulf are returning to normal.
However, the physical data continues to paint a much more nuanced picture.
The best example is probably Cushing, the main delivery hub for the U.S. WTI contract. According to the latest data released on June 19, inventories have fallen to just 19 million barrels, down from more than 31 million barrels in the spring:
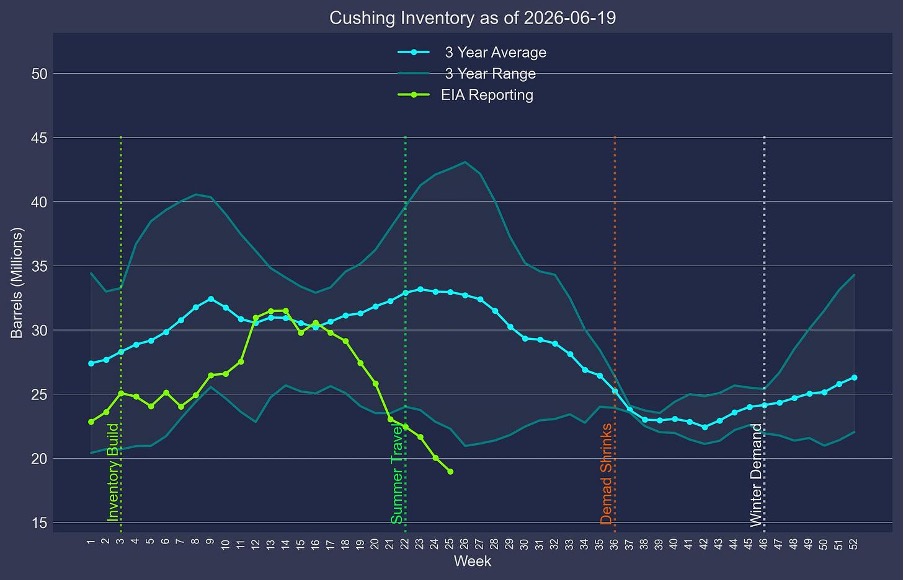
The chart above shows just how exceptional the situation is: not in several years have inventories fallen so far below their seasonal average. We are now practically at the operational minimum, generally estimated to be between 18 and 20 million barrels.
It is worth recalling what this threshold actually means. Contrary to what some alarmist commentary suggests, pipelines do not suddenly shut down when Cushing falls below 20 million barrels. However, the system gradually loses its flexibility. Blending operations become more complex, logistical arbitrage becomes more costly, and holders of physical crude gain increasing leverage over short sellers. Historically, tensions arise well before a physical breakdown of the system.
This deterioration in inventories is occurring even as U.S. strategic reserves continue to dwindle. The Strategic Petroleum Reserve (SPR) has now fallen to around 330 to 340 million barrels, less than half of its historic peak of over 700 million barrels. In other words, the safety buffers accumulated over several decades continue to be drawn down to maintain market balance.
It is against this backdrop that we must evaluate the numerous optimistic analyses published in recent days regarding the reopening of the Strait of Hormuz. Reuters and several observers have highlighted the resumption of maritime traffic in the strait. On June 22, nearly 20 energy tankers representing approximately 24 million barrels of loaded capacity were recorded. For many, that day marked a true “jailbreak” for the oil market.
However, this interpretation does not hold up to closer scrutiny.
First, a significant portion of these volumes came from Iranian destocking. Of the nine VLCCs recorded that day, three were carrying approximately 6 million barrels of Iranian crude, primarily destined for China. These barrels therefore have virtually no impact on Western supplies.
Second, the oft-cited 24 million barrels observed in a single day must be compared to daily Western consumption of more than 45 million barrels. Even if all of these volumes were destined for Europe, the United States, and Japan — which is clearly not the case — their contribution would remain limited.
Third, the spectacular rebound observed on June 22 increasingly appears to be merely a logistical catch-up rather than a true return to normal oil flows. Several observers have pointed to the twenty energy tankers recorded that day — representing approximately 24 million barrels of loaded capacity — to conclude that the Strait of Hormuz crisis was behind us. However, shipping traffic data tells a very different story:
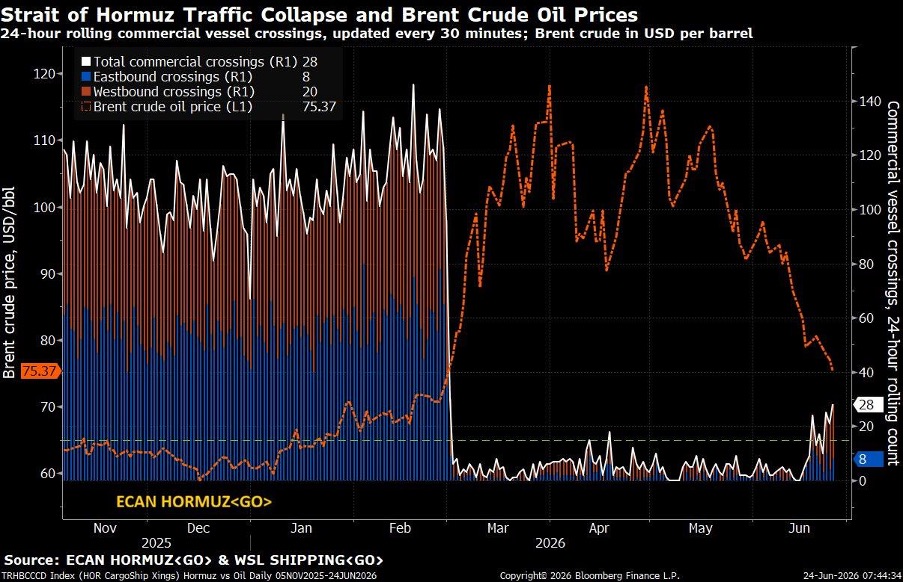
As shown in the graph above, the number of daily commercial crossings through the strait remains extremely low compared to pre-conflict levels. While more than 100 commercial vessels passed through the Strait of Hormuz daily before the crisis, traffic plummeted in the spring, at times falling below 10 crossings per day. Even today, despite the recent improvement, traffic represents only a fraction of historical levels.
Above all, developments in the days that followed cast serious doubt on the idea of a full reopening. The very day after the “jailbreak” celebrated by the markets, documented transit capacity fell back to around 6 million barrels — nearly four times less than the previous day. This volatility is typical of a bottleneck-relief phenomenon: cargoes that have accumulated over several weeks leave the region simultaneously when conditions improve, creating the illusion of a return to normal. But once this backlog of waiting ships has been cleared, traffic quickly returns to its underlying pace.
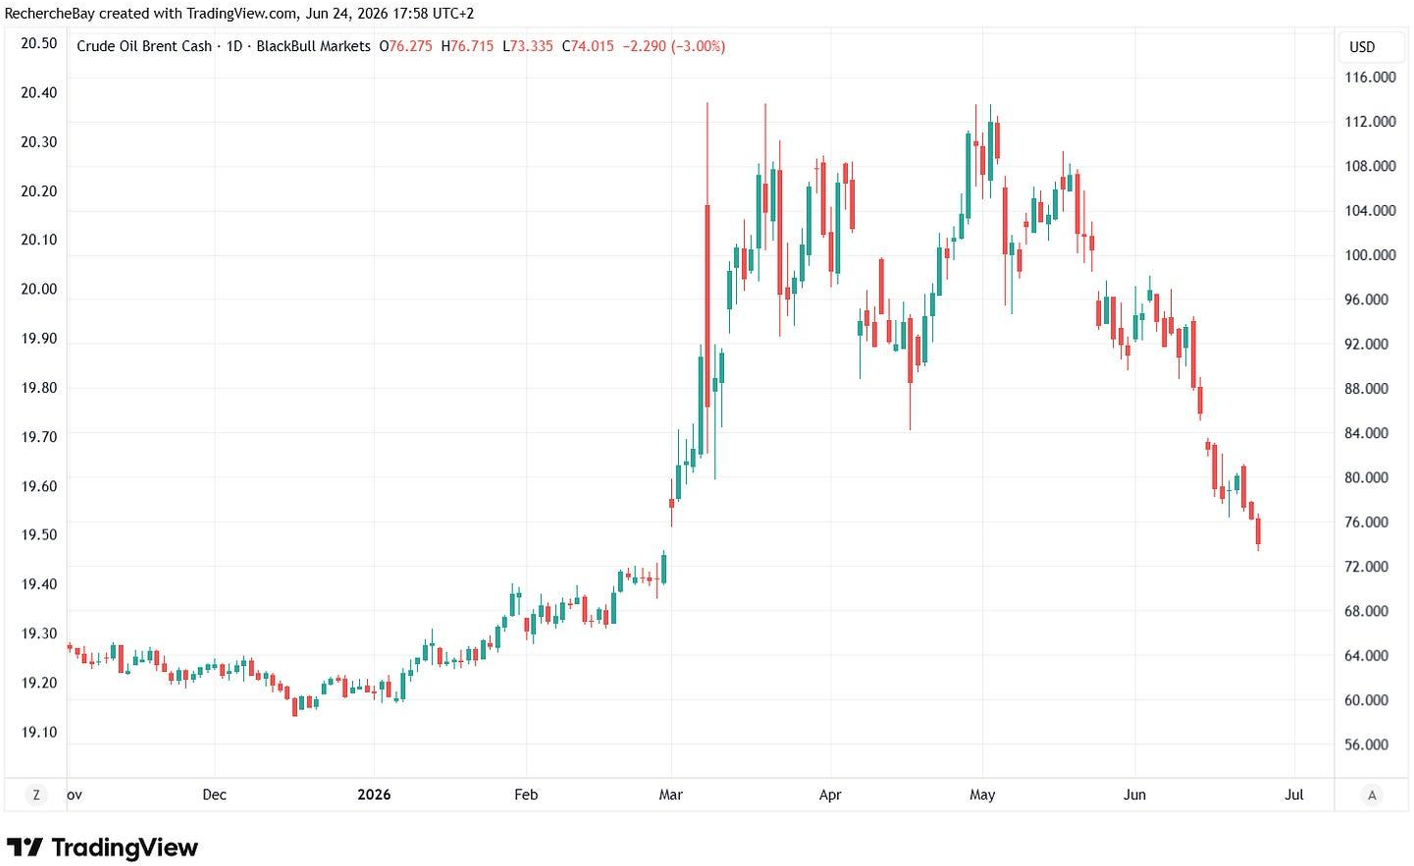
The chart also highlights another paradox: while commercial vessel traffic remains well below its usual levels, Brent crude has rebounded to around $72 — nearly its pre-crisis level. In other words, the oil market currently appears to be pricing in an almost complete normalization of flows, even though shipping data still shows the system operating well below its usual capacity. This divergence is all the more striking given that global inventories continue to decline and that several strategic storage hubs — notably Cushing — are at historically low levels. In reality, the market appears to be confusing the reopening of a shipping route with the sustained recovery of the physical flows traveling along it. Yet these two phenomena are far from equivalent.
In other words, the exceptional figures observed immediately after the reopening could simply reflect the clearance of cargoes that had been delayed for several weeks.
But perhaps the most revealing development came from India this week.
Indian Oil Corporation (IOC) received no bids in certain tenders to charter vessels to load crude oil and LPG at ports located within the Strait of Hormuz. This information is particularly significant because IOC is India’s largest refiner and one of the world’s largest oil buyers.
If the Strait of Hormuz had truly returned to normal, why would one of the world’s leading oil importers still be having trouble finding ships?
The answer is simple: a strait that is officially open is not necessarily a strait that is functioning normally. Shipowners continue to face high insurance costs, significant operational constraints, and ever-present geopolitical risks. The issue is no longer simply whether oil exists, but whether it can be transported under economically viable conditions.
Data on maritime traffic confirms this caution. While loaded ships are gradually leaving the Gulf, the number of returning ballast ships remains much lower than before the war. Before the conflict, more than a hundred crude oil tankers were regularly present or waiting in the Gulf. Today, that number remains significantly lower. The real indicator to watch is therefore no longer the number of ships leaving the Strait of Hormuz, but the number of empty ships ready to return there.
This caution on the part of shipowners is also due to the skyrocketing cost of transportation. Before the conflict, war insurance premiums generally amounted to a few dozen cents per barrel. Today, according to several market estimates, the additional cost — combining insurance, geopolitical risk, and higher charter rates — can reach between $5 million and $7 million for a VLCC making a round trip in the Gulf. Based on a standard cargo of two million barrels, this amounts to approximately $2.50 to $3.50 per barrel. Added to this are the extra costs associated with potential detours, waiting times, the scarcity of available vessels, and the increased requirements of insurers and banks.
For an Asian importer, the total cost of shipping a barrel from the Gulf can thus easily increase by several dollars. In some cases, industry professionals now cite an implicit cost of close to $10 to $12 per barrel compared to pre-crisis conditions. With Brent at $72, this amounts to a logistics premium of nearly 15% on the price of crude. In other words, even though oil is officially available at $72 on the markets, the actual cost per barrel delivered may be much higher for the end buyer. The current paradox is that the drop in oil prices does not necessarily encourage a return of flows to the Gulf. Brent prices have corrected, but transportation, insurance, and geopolitical risk premiums remain exceptionally high. For many importers, it remains more economically rational to draw on their strategic or commercial reserves than to purchase crude from the Gulf under current conditions. In other words, the drop in oil prices has not yet translated into a genuine improvement in the physical market. As long as logistics costs remain disproportionate to the value of the crude itself, the normalization of flows is likely to proceed much more slowly than financial markets currently anticipate.
This is precisely what makes the recent drop in Brent prices misleading. Financial markets are focused on the quoted price of oil, while players in the physical market continue to pay a significant premium to secure the ships, insurance, and logistics needed to transport cargoes. This divergence explains why refiners, traders, and importers remain much more cautious than the prices observed on the freight futures markets would suggest — and these markets, in fact, confirm this caution. While loaded ships are gradually leaving the Gulf, the number of returning ballast ships remains much lower than before the war. Before the conflict, more than a hundred crude oil tankers were regularly present or waiting in the Gulf. Today, that number remains significantly lower. The key indicator to watch is therefore no longer the number of ships leaving the Strait of Hormuz, but the number of empty ships ready to return there.
Finally, investor behavior further highlights this contrast between the financial market and the physical market. Funds’ short positions on Brent now exceed $18 billion, a historic record:
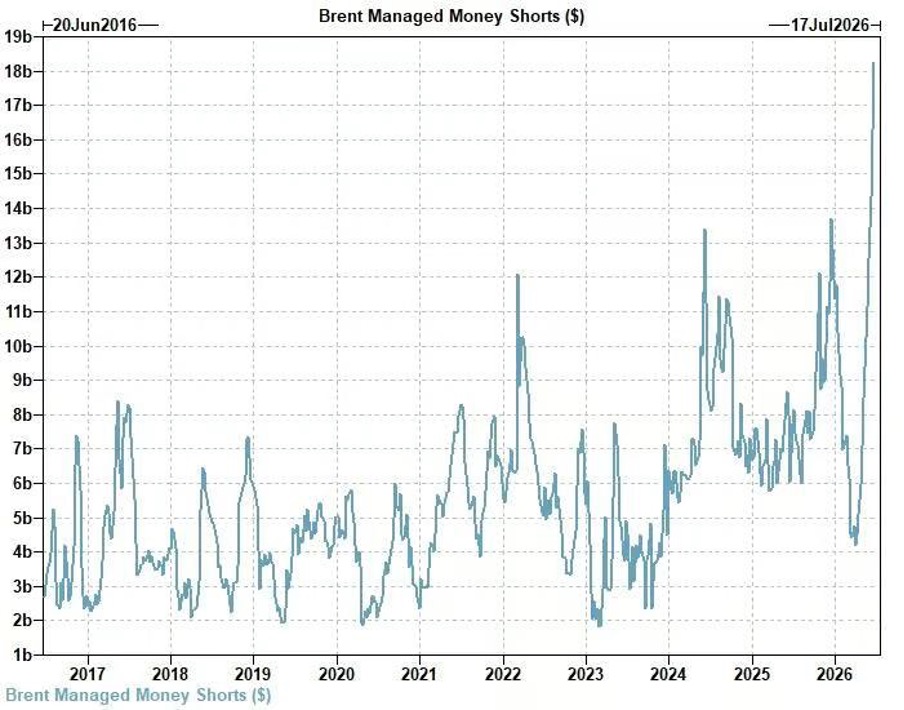
The USO oil fund even shows short interest exceeding the number of shares actually outstanding. Never before has the market bet so heavily on a sustained decline in oil prices.
This situation creates a remarkable paradox. On the one hand, speculative investors consider the crisis to be over. On the other, inventories at Cushing are reaching critical levels, the Strategic Petroleum Reserve (SPR) continues to deplete, several global hubs remain under strain, and major Asian importers are still struggling to secure their supplies.
The market is currently celebrating the reopening of the Strait of Hormuz. Inventories, however, continue to tell the story of a system that is still living off its reserves. The central question is no longer whether ships are passing through the strait, but whether the flows currently being observed reflect a lasting recovery in global supply or simply the accelerated drawdown of inventories accumulated during the crisis. This is likely where the future of the oil market will be decided in the coming weeks.
This recent correction in oil prices also helps explain some of the weakness seen in gold prices:
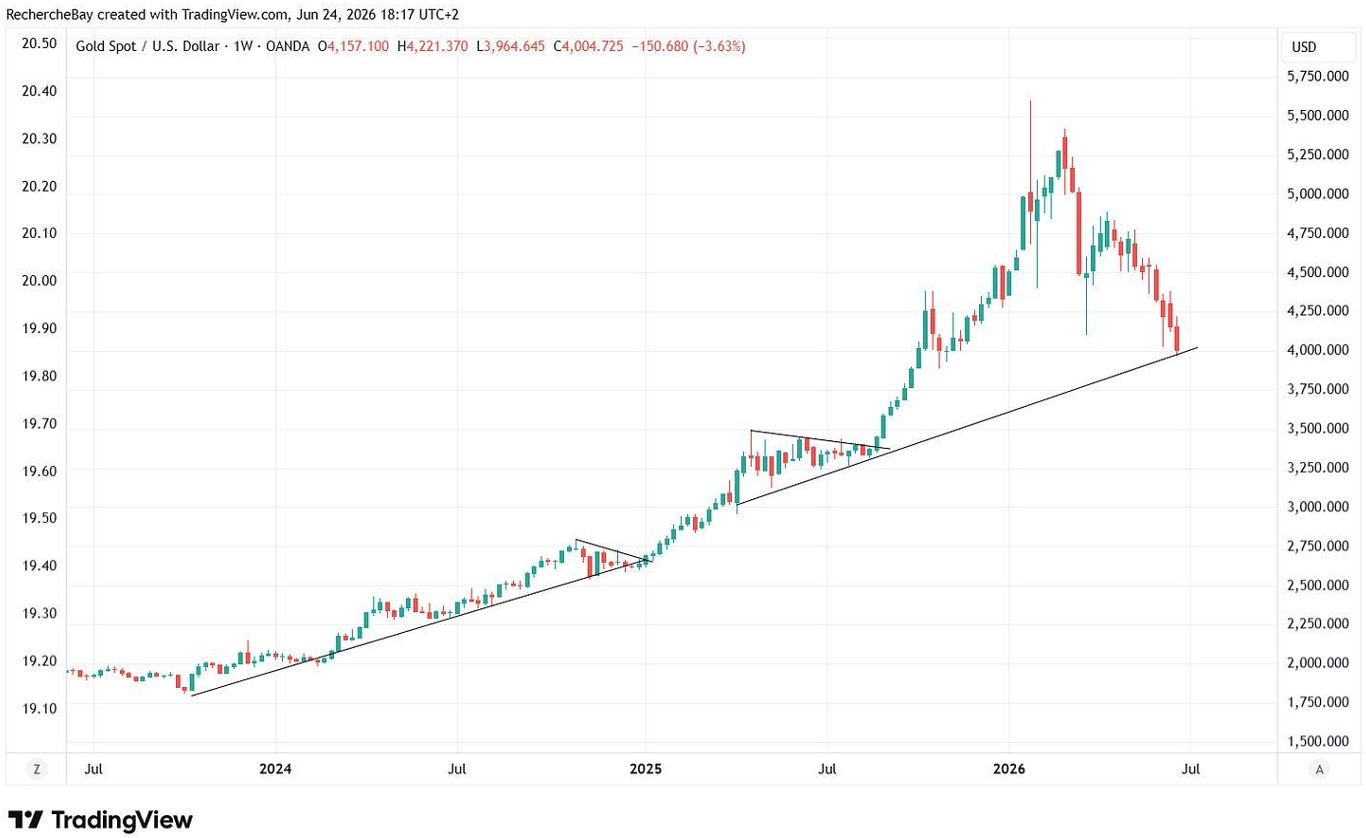
In financial markets, oil remains the benchmark commodity and plays a central role in inflation expectations. When Brent crude falls significantly, investors tend to revise their expectations regarding future inflationary pressures downward. This decline in expectations generally leads to a rise in real interest rates and a strengthening of the dollar — two factors that are traditionally unfavorable for gold.
The mechanism is relatively simple. Lower oil prices reduce immediate concerns about energy costs, inflation, and economic disruptions. Investors then shift away from safe-haven assets and back toward bonds and the dollar. At the same time, commodity-focused funds often reduce their exposure to the broader commodity complex when oil prices correct sharply. Although gold responds to monetary dynamics that are very different from those of oil, it is frequently sold off during these phases of widespread disengagement from the commodities sector.
The decline in oil prices therefore acts as a double headwind for gold: it supports the dollar in the short term while weighing on inflation expectations, which are one of the main drivers of the gold market. This correlation, however, is often temporary. If physical tensions in the oil market were to reemerge, or if the current decline in crude oil prices turned out to be linked more to an excess of short positions than to a genuine improvement in fundamentals, the trend could quickly reverse. In this scenario, a simultaneous rise in oil prices, inflation expectations, and concerns about financial stability would restore gold’s traditional role as a safe-haven asset and a hedge against monetary erosion.
Reproduction, in whole or in part, is authorized as long as it includes all the text hyperlinks and a link back to the original source.
The information contained in this article is for information purposes only and does not constitute investment advice or a recommendation to buy or sell.


