Oil stocks in Cushing, Oklahoma, fell this week to just 21.6 million barrels, barely 1.6 million barrels above the operational threshold generally estimated at around 20 million. At the current rate of drawdowns, this level could be reached within the next two weeks:
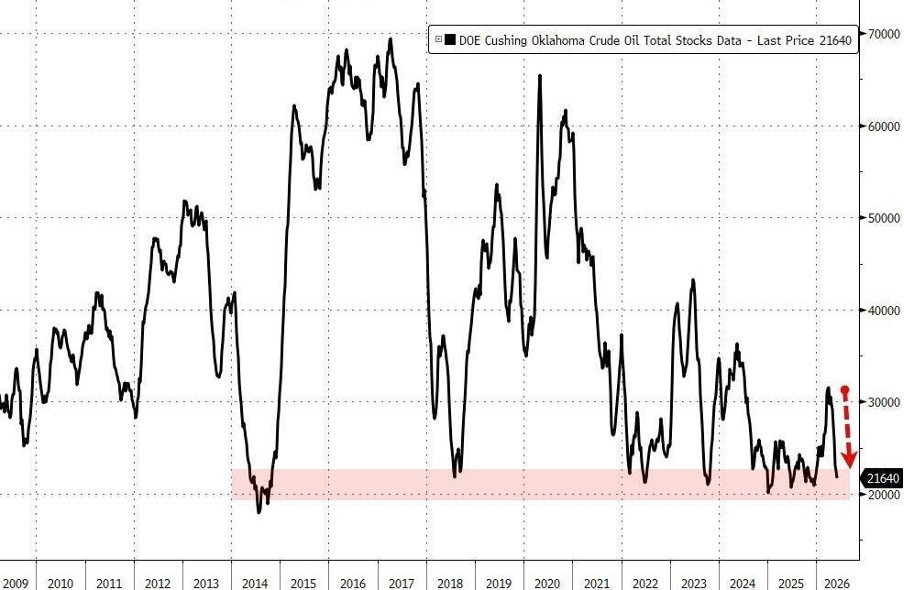
For most investors, this figure probably doesn’t mean much. After all, the United States still has hundreds of millions of barrels of oil scattered across the country. So why are a few million barrels stored in Oklahoma attracting so much attention?
The answer is that Cushing is not just an ordinary oil storage facility. It serves as the primary physical delivery point for the WTI contract, the benchmark for U.S. crude oil. In practice, Cushing plays a role comparable to that of a clearinghouse in the banking system: it isn’t necessarily where the majority of the oil is located, but it is one of the points where the daily balance between buyers and sellers is struck.
More importantly, when Cushing’s inventories approach 20 million barrels, the market considers the system to have reached its operational minimum. Contrary to what one might think, a storage facility cannot be completely emptied. Some oil must remain in place to maintain facility pressure, ensure pipeline operation, and enable logistics. Below a certain threshold, the last barrels become progressively harder to mobilize.
This distinction is crucial. The risk is not that the United States will run out of oil overnight. The risk is that the market will begin to run short of oil that is immediately available exactly where it is needed. As in a banking crisis, it is not the total amount of money in the system that matters, but the liquidity available in the right place at the right time.
This is precisely what is worrying some market players today. For as Cushing nears its operational capacity limit, the mechanisms that have so far helped cushion the energy shock are also beginning to run out.
For several months now, the United States has been offsetting some of the global disruptions by drawing heavily on its strategic reserves. A significant portion of these volumes comes from delivery contracts signed several weeks in advance. However, these deliveries are gradually coming to an end. Flows from the strategic reserve, which still amounted to the equivalent of about 76 million barrels per month, are expected to drop to around 22 million in the coming weeks. In other words, the market will continue to receive strategic oil, but at a significantly slower pace than today.
At the same time, the U.S. Strategic Petroleum Reserve itself stands at just 349.2 million barrels, only 2.4 million above its all-time low reached in 2023. The market is therefore no longer content to simply draw down its stocks: it is beginning to lose the mechanisms that allowed it to slow their depletion.
It is this combination — declining commercial inventories, a slowdown in strategic deliveries, and the approaching critical threshold at Cushing — that explains why several oil industry executives have been issuing repeated warnings for several weeks. The debate is no longer simply whether the system can still absorb the current shock, but how long it can continue to do so before physical constraints become impossible to ignore.
Beyond the mere level of U.S. inventories, the current situation primarily reflects the growing tensions emerging in the global physical oil market. For several months now, disruptions to flows from the Gulf have forced major importers to turn to alternative supply sources. Available cargoes are being rerouted, shipping routes are lengthening, and buyers are competing to secure increasingly scarce volumes. As long as strategic and commercial inventories can cushion the shock, this tension remains relatively invisible. But it is gradually manifesting as a much more significant phenomenon: energy-related liquidity stress.
This strain is particularly acute in countries that are heavily dependent on physical oil imports from the Middle East. Japan, South Korea, India, and several European economies must now devote more capital to securing their supplies. Oil companies, refiners, airlines, and major importers must tie up more cash to finance their purchases, hedges, and safety stocks. As in any liquidity crisis, the problem is not just the price of oil itself, but the amount of capital needed to keep the system running.
When an oil-importing country sees its energy bill rise sharply, additional pressure is placed on its currency. Importers must sell more local currency to buy dollars, the currency in which most of the global oil trade is conducted. This increased demand for dollars exerts downward pressure on the currencies of importing countries and sometimes forces central banks to intervene to limit their depreciation.
It is within this context that certain movements observed in the gold market must be understood:
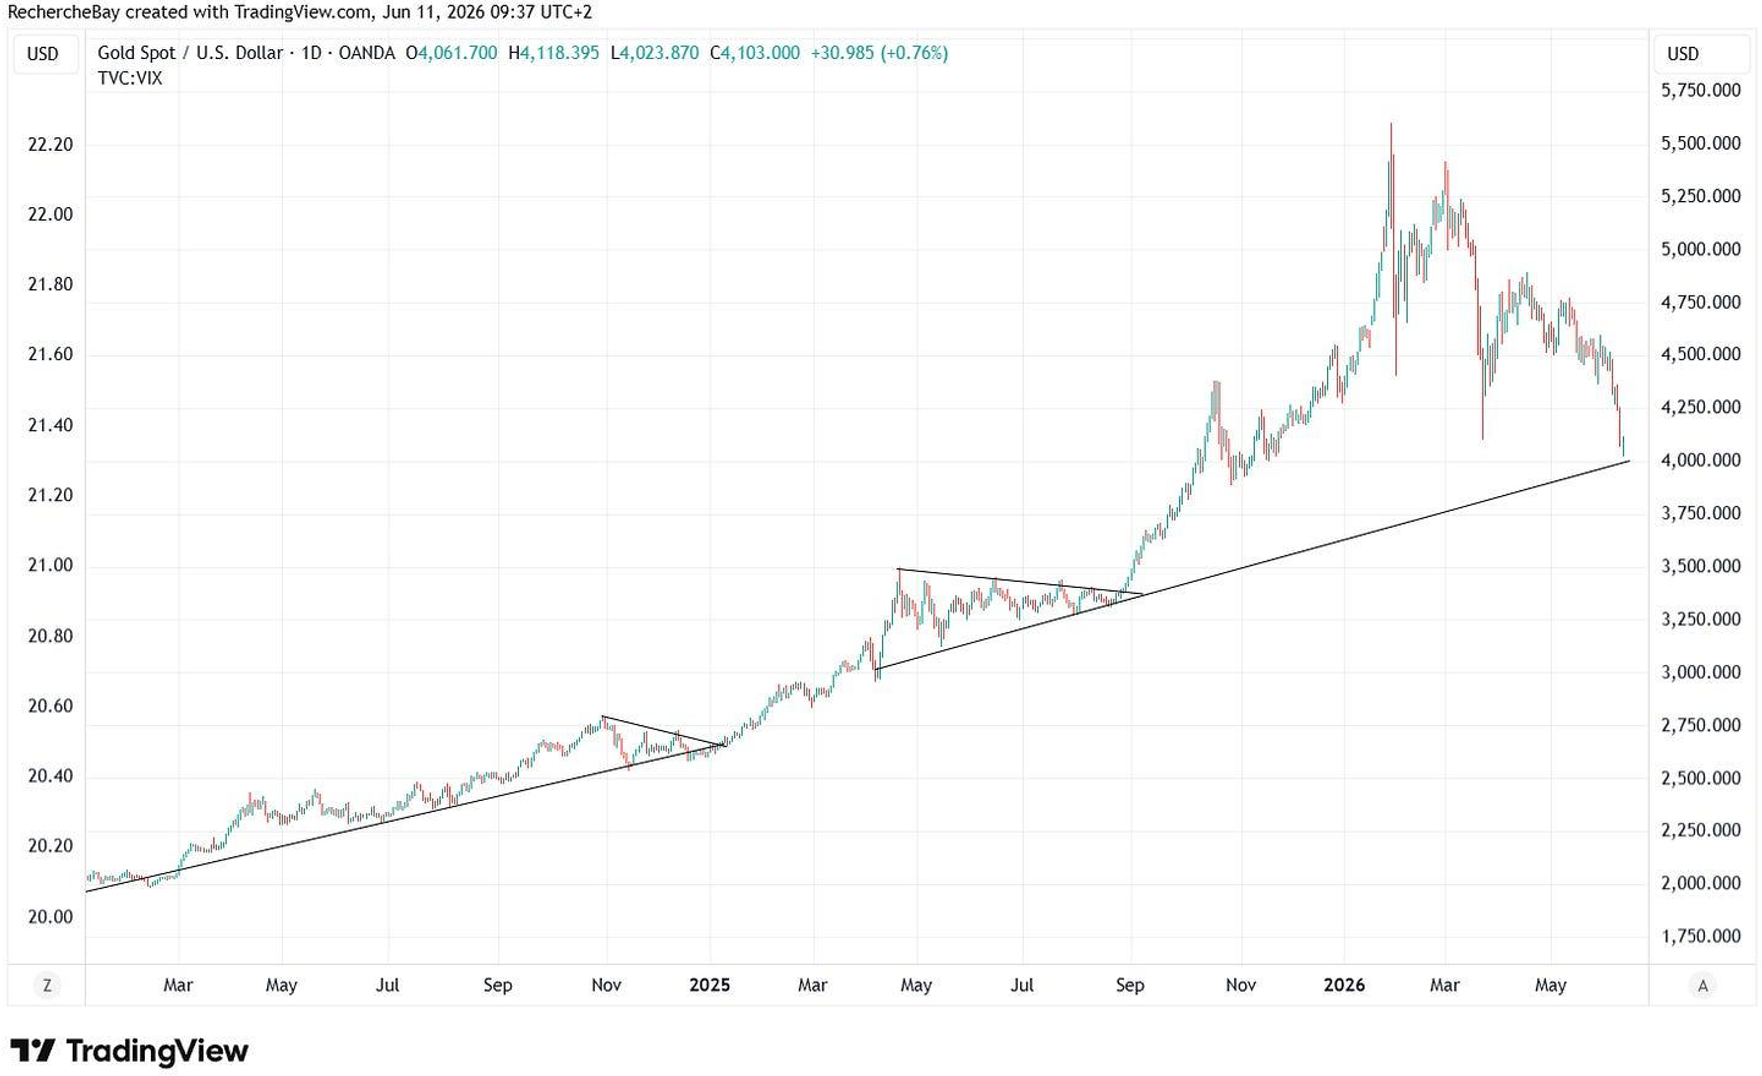
In the early stages of a liquidity crisis, gold is not always immediately purchased as a safe-haven asset — it is often sold. Central banks, sovereign wealth funds, financial institutions, and sometimes even private investors then use their most liquid assets to quickly obtain dollars. Gold is precisely one of the most readily convertible assets globally. Some of the selling of the precious metal observed during periods of market stress therefore does not necessarily reflect a loss of confidence in gold itself, but rather an urgent need for liquidity.
This mechanism has already been observed during several major crises. In March 2020, at the height of the financial panic, gold prices temporarily fell even as systemic risks were escalating. The reason was simple: market participants needed dollars immediately and were selling whatever they could. Once this period of stress had passed and liquidity was restored by central banks, gold subsequently rebounded sharply.
This also explains why the yen’s performance deserves particular attention today. Japan imports nearly all of its energy and is on the front lines of rising supply costs.
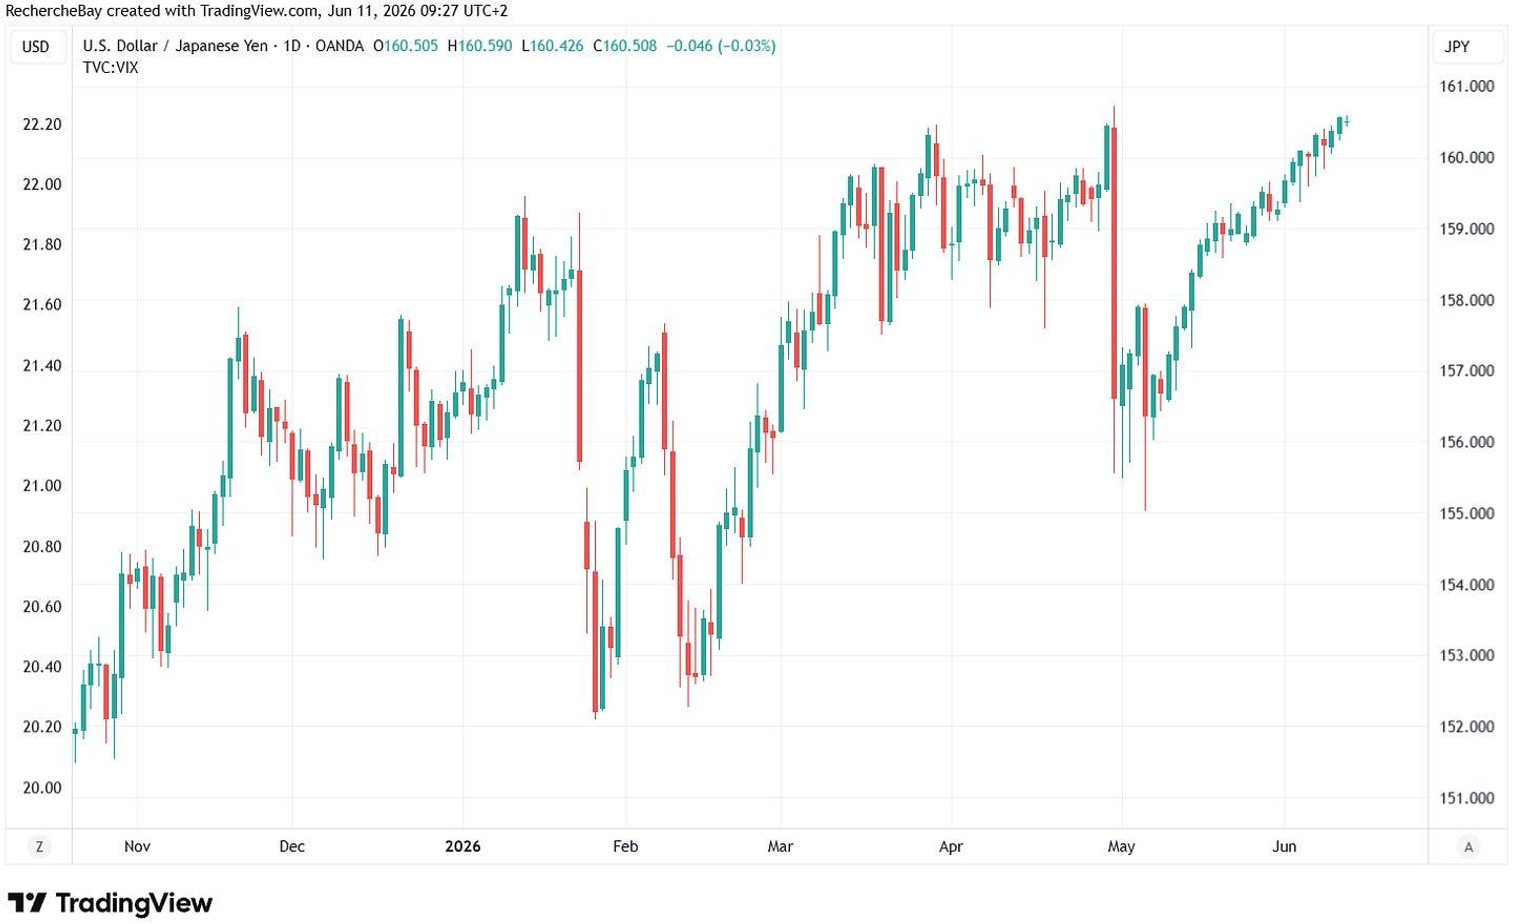
The longer tensions persist in the physical oil market, the greater the need for dollar-denominated financing becomes. The yen’s persistent weakness can thus be interpreted as an early warning sign of liquidity strains developing in the countries most dependent on energy imports. In this context, one-off gold sales should not be interpreted as a return to normal, but potentially as a symptom of a financial system desperately seeking dollars to absorb a growing energy shock.
Another explanation for the recent consolidation in the gold price lies in the evolution of monetary policy expectations. If the physical oil market does indeed continue to tighten, the logical consequence is a gradual rise in inflation expectations. However, financial markets focus less on current inflation than on the potential reaction of central banks to this future inflation.
Comparing recent trends in U.S. inflation with those of the decade marked by oil shocks, we observe that the two trajectories have so far followed a surprisingly similar pattern: after an initial spike, inflation temporarily recedes before rising again.
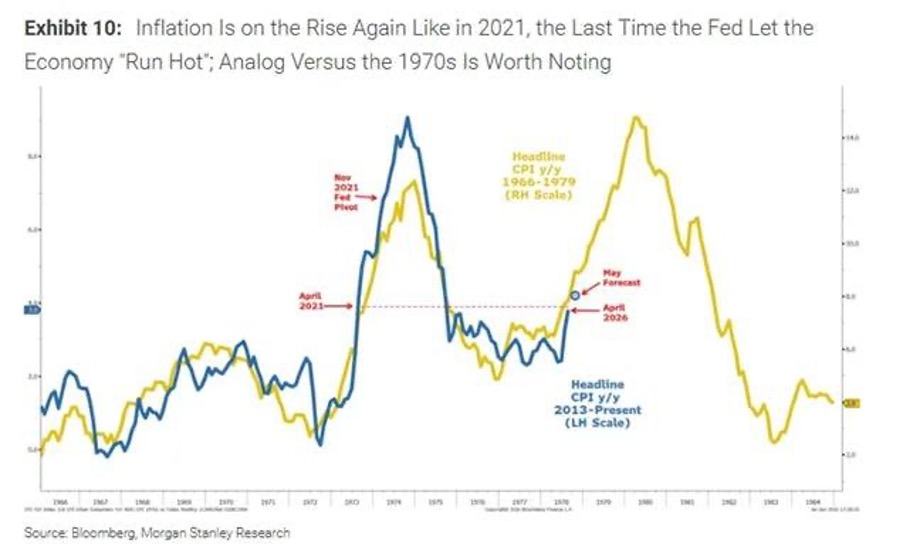
This is precisely what happened after 1976, when the Federal Reserve eased its monetary policy too quickly. For investors, this parallel serves as an important warning. If current energy tensions fuel inflation again in the coming months, the Fed may be forced to keep rates high longer than expected, or even abandon hopes for monetary easing — which currently underpin much of the optimism in financial markets.
Every sustained rise in oil prices increases the risk of inflationary pressures reemerging in the coming months, leading some investors to anticipate that high interest rates will persist for an extended period — or, in certain extreme scenarios, a return to rate hikes.
This dynamic is traditionally unfavorable for gold in the short term. Unlike a bond or a bank deposit, gold pays no income. When bond yields rise and markets anticipate higher policy rates, the opportunity cost of holding gold automatically increases. Some investors then temporarily reduce their exposure to the precious metal to reposition themselves into assets offering a more attractive nominal yield.
This reaction, however, is often misleading. Historically, the early stages of an oil shock frequently trigger a rise in bond yields and a consolidation in gold. But when investors realize that central banks face an insoluble dilemma — fighting inflation or preserving financial stability — gold’s behavior generally shifts in nature. The market then stops focusing on the level of nominal rates and instead turns its attention to the actual credibility of monetary authorities.
This is the paradox investors are facing today. On the one hand, rising oil prices are pushing inflation expectations higher and supporting bond yields, which is temporarily weighing on gold. On the other hand, a prolonged energy shock is simultaneously weakening growth, financial markets, and several banking systems already under pressure. In such an environment, central banks actually have much less room to maneuver than they did during previous inflationary cycles.
In other words, the current correction in gold probably reflects less an improvement in the economic outlook than a transitional phase during which the market is still trying to determine whether the next response from central banks will be more focused on fighting inflation or on preserving financial stability. It is often during this period of uncertainty that the precious metal undergoes its most misunderstood consolidations.
Reproduction, in whole or in part, is authorized as long as it includes all the text hyperlinks and a link back to the original source.
The information contained in this article is for information purposes only and does not constitute investment advice or a recommendation to buy or sell.


