To understand something as complex as gold, it is often helpful to shift one’s perspective. I did this last year by proposing a logarithmic interpretation of its price; here is another approach.
We almost always look at the price of gold relative to the dollar. This is its benchmark price, which makes sense since the dollar remains the world’s leading currency. We then observe that it tends to rise, particularly because the money supply is increasing — through money printing — while the quantity of gold grows much more slowly. Each year, approximately 3,000 tons of gold are mined, a modest volume compared to the existing stock, estimated at some 180,000 tons. Gold’s “inflation” is therefore very low (about 1.6%, or 3,000/180,000), lower than that observed in the United States. Gold thus constitutes a sound long-term investment for preserving, or even improving, one’s purchasing power. This reasoning naturally applies as well to the euro and other currencies.
To better analyze the price of gold, it may therefore be interesting to compare it to another scarce asset, and one naturally thinks of bitcoin, often referred to as “digital gold.” Here is the price of an ounce of gold expressed in bitcoin (BTC):
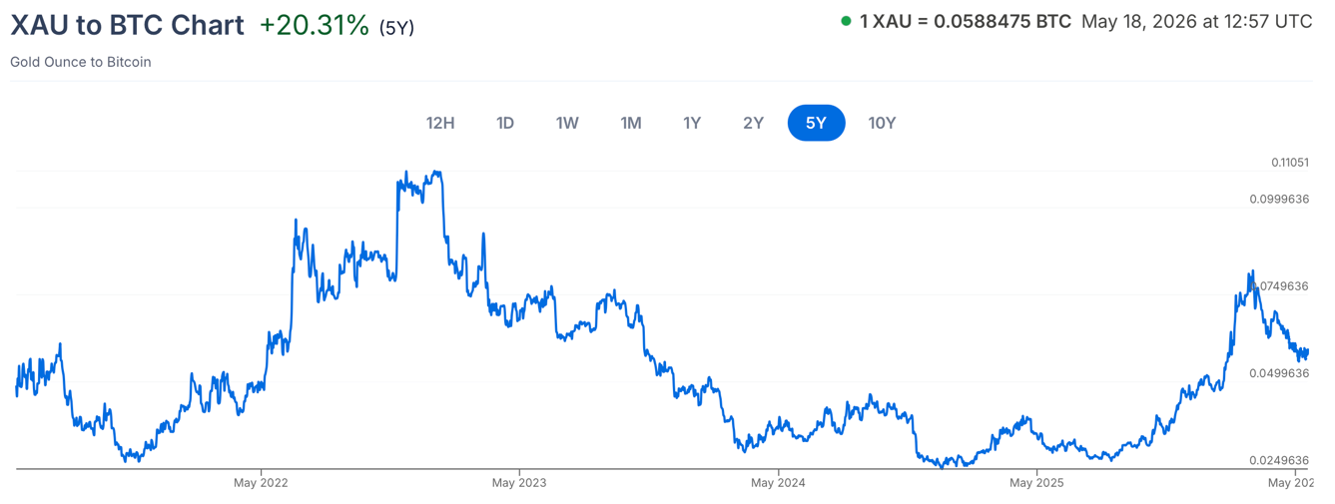
We are limiting ourselves here to the last five years, as the comparison loses its relevance over a ten-year period: in its early days, bitcoin was still too underdeveloped.
XAUT refers to a cryptocurrency that represents one ounce of gold (31.10 grams).
The price of gold per ounce rises relative to bitcoin starting in early 2022, mainly because bitcoin collapses, hitting a low of around $16,000 in December 2022 following the bankruptcy of FTX. BTC then begins its recovery and accelerates significantly in early 2024 with the approval of bitcoin ETFs ($70,000 as of March 30, 2024).
The year 2025, particularly its second half, is marked by a sharp rise in gold while bitcoin continues to lag behind; the price per ounce therefore appreciates significantly, as shown in the chart.
However, a slowdown is observed starting on February 28, the date corresponding to the outbreak of the war between Iran, the United States, and Israel. Gold, after its sharp rise, stalls, while bitcoin holds up better and even begins to rise slightly again. As a result, gold priced in BTC declines. It remains to be seen whether this trend will hold over the long term.
The chart also highlights what technical analysts call a “resistance level,” in this case a floor around 0.025: on four occasions, gold approaches this level before rebounding (October 2021, March 2024, December 2024, and August 2025).
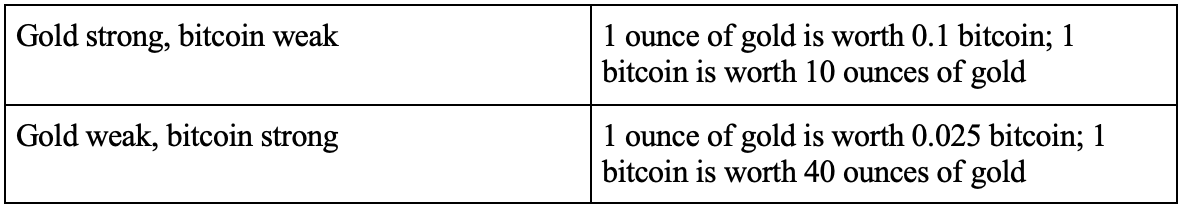
Take the example of December 17, 2024: gold is trading at €2,610, bitcoin at €106,000, meaning one ounce of gold is worth 0.0246 BTC. Conversely, one bitcoin is then worth about 40 ounces of gold (1/0.025), which appears to constitute a ceiling for it.
Gold thus appears relatively weak, with bitcoin outperforming — one relative to the other, independent of the dollar.
Conversely, on January 4, 2023, at the peak of the chart, gold is trading at $1,800 and BTC at $16,600. An ounce of gold is then worth one-tenth of a bitcoin (0.1), or, put another way, one bitcoin is equivalent to 10 ounces of gold (1/0.1). This level appears to mark a ceiling for the yellow metal and a floor for the crypto: gold is then in top form, while bitcoin is at its worst.
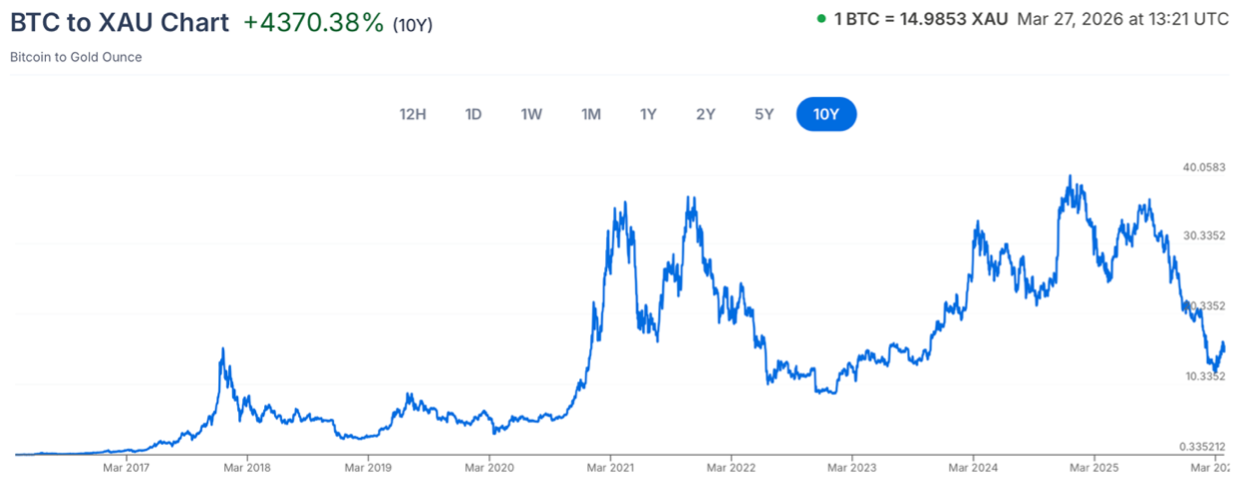
This ceiling of around 40 ounces of gold per bitcoin becomes clearly visible when we invert the previous chart — that is, by expressing bitcoin in terms of gold — and adopt a slightly longer observation period, including 2021. Bitcoin then reaches its “peak” at around 40 ounces of gold, a level it has hit three times before a pullback (April and October 2021, then December 2024):
In summary, here are the key figures to keep in mind and watch for:
Let’s call this chart the “GoldBTC1040.” Since the beginning of 2021 — before that, bitcoin was still too underdeveloped for the comparison to be truly meaningful — these two boundaries have held and triggered a price reversal whenever they were approached too closely. They form a sort of tunnel within which gold and bitcoin move relative to one another.
What do these two boundaries mean? In our view, they reflect shifts in perception surrounding these two rather unique assets.
Admittedly, each has its staunch defenders, but some of their holders waver and regularly reassess their judgment (“Gold? Meh, it doesn’t yield anything… oh wait, there’s inflation,” “Bitcoin is a tech asset… oh no, it’s also used to store value,” etc.).
And despite their many differences (physical versus digital, a history spanning millennia versus creation in 2009, etc.), gold and bitcoin remain close in their value proposition (scarcity, negligible inflation of around 1%). It therefore makes sense that they do not diverge too far from one another.
Now, if one of these two thresholds were to be crossed on a sustained basis, it would likely signal a profound shift in the relative perception of these two assets. It remains to be seen whether such a scenario will materialize: it would be a strong signal.
In conclusion, beyond their prices in dollars or euros, it is useful to regularly monitor the gold-to-bitcoin ratio, as it provides particularly relevant insights.
Their fates seem, in a way, intertwined…
Reproduction, in whole or in part, is authorized as long as it includes all the text hyperlinks and a link back to the original source.
The information contained in this article is for information purposes only and does not constitute investment advice or a recommendation to buy or sell.


