Gold and silver dropping back again late last week had investors in the Precious Metals sector feeling despondent, especially as their fears were magnified by at least one analyst calling for gold to drop to the low $900’s or even lower, which is normal when prices sink, but our charts are instead suggesting that gold and silver are close to completing giant bottoming patterns that started to form (in the case of gold) as far back as 2013.
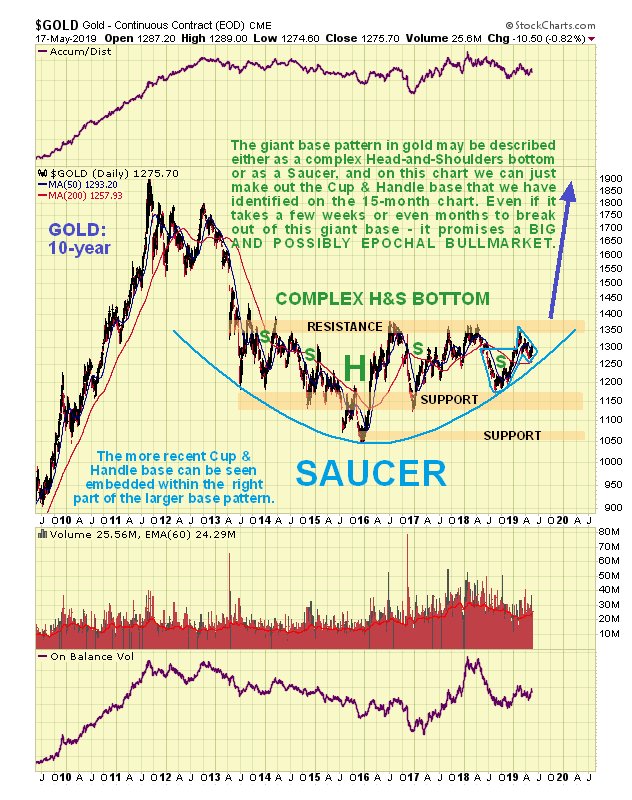
We can best see gold’s potential giant base pattern on a 10-year chart. It can be described as a complex Head-and-Shoulders bottom or as a Saucer, and is best considered to be both, or perhaps as a hybrid having the characteristics of both patterns. In any event, as we can see on this chart, it appears to be drawing close to breaking out of it, which will be a very big deal if it happens, because a base pattern of this magnitude can support a massive bullmarket. As for timing it could take several months and it is most likely to happen during gold’s seasonally strong period from July through September. To maintain the bullish case it must stay above the Saucer boundary.
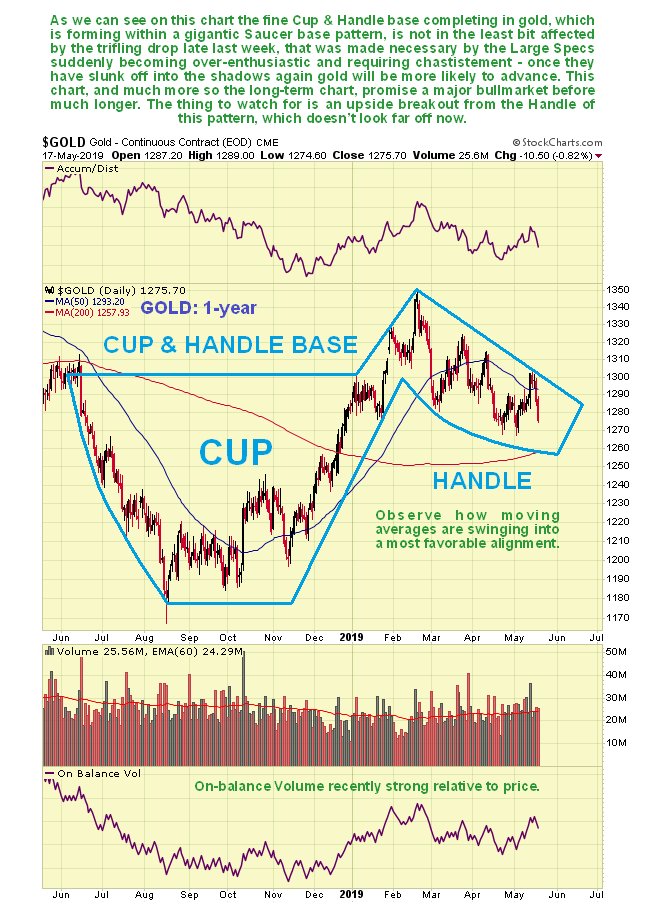
Embedded within the giant H&S or Saucer base pattern, a fine Cup & Handle base has formed over the past year which we can see to advantage on the 1-year chart. The Handle part of this pattern may be regarded as a period of consolidation / reaction that has allowed time both for the earlier overbought condition arising from the rally from November through February to unwind and also for the moving averages to slowly swing into a much more favorable alignment, which has now happened.
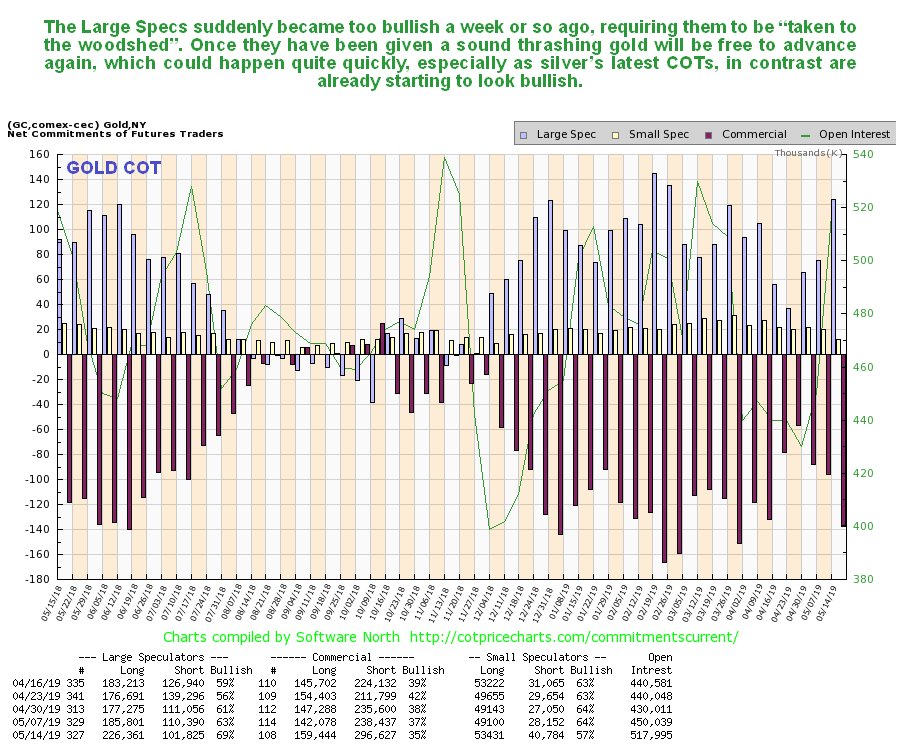
On both of the above charts the drop late last week looks like “a storm in a teacup” or given the pattern shown on the 1-year chart, a storm just outside a teacup, and latest COTs reveal the reason for it – the Large Specs had suddenly become too bullish, which meant that they needed to be disciplined. While COTs have doubtless improved as a result of the drop on Thursday and Friday (we won’t find out until next week), the Large Specs may require some more time in the correctional facility, especially as June and July are not seasonally good months for the Precious Metals, so it would not be surprising to see some more downside during the weeks ahead before both gold and silver take a turn for the better from July onwards.
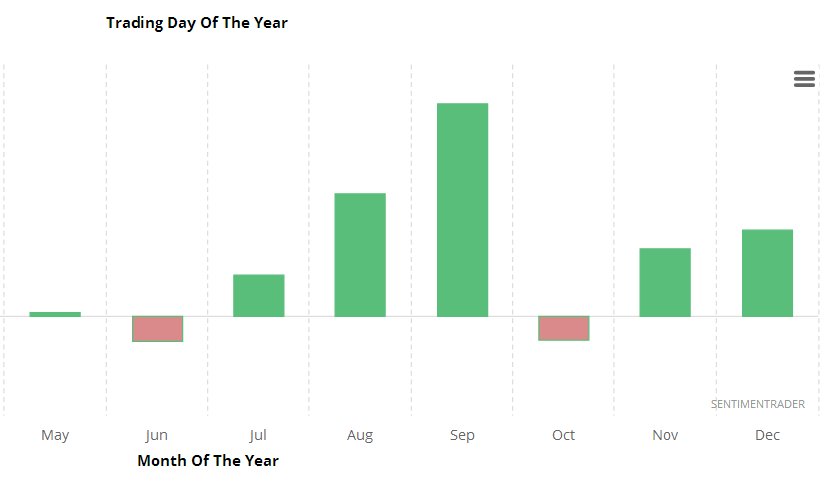
The following seasonal chart shows that June tends to be somewhat negative for gold on average, although it won’t be this year if Iran is attacked.
The conclusion is that the big picture for gold and silver continues to look strongly positive, although we may first have to contend with weakness between now and July due to the current downtrend coupled with negative seasonal factors until the end of June, which should present a window of opportunity to build positions across the sector ahead of the expected late Summer advance that promises to be very substantial if gold succeeds in breaking above the key $1400 level.
Original source: Clivemaund
Reproduction, in whole or in part, is authorized as long as it includes all the text hyperlinks and a link back to the original source.
The information contained in this article is for information purposes only and does not constitute investment advice or a recommendation to buy or sell.


