In the last 48 years, since 1969, an investor who put $1,000 into the Dow would today have $33,000. That is a gain of 3,200% or 7.6% annually. On the other hand, someone who put $1,000 into gold in 1969 would today have $37,000 or 7.8% annual return. But if you add dividends to the Dow, the return is far superior at 10.7% with the dividends reinvested.
1969 seems like an arbitrary start year but it happens to be the year that I started my first job. No one could of course have predicted any of those returns. The previous 48 years from 1921 to 1969, the Dow only went up 9X but with higher dividends in that period the total return would still have been 10% annually. Gold on the other hand only had one move up during that period from $31 to $45 in 1933 when the dollar was devalued. That is a meagre 1.5X increase. Due to the gold standard, those 48 years had relatively sound money and therefore limited credit creation with the exception of WWII.
Although history can be an excellent teacher, it tells us nothing about the future. Very few would have predicted a 23,000 Dow 48 years ago. So what will happen in the next 48 years. I certainly will not have to worry about that but my children might and my grandchildren certainly will. If I today gave my grandchildren a gift, would it be stocks or gold?
Dow 1,000 next
During the last 48 years there were four horrendous drawdowns in the Dow of between 39% and 54%. See chart below. Anyone who was invested in the Nasdaq 2000-02 will most certainly remember the 80% drawdown with many stocks going to zero. Looking 30 years at the 1987 crash for example, I remember that day vividly. I was in Tokyo to list a UK company, Dixons (I was Vice-Chairman), on the Tokyo Stock Exchange. Not the best day for a Japanese listing. It was Monday October 19 and became known as Black Monday. Looking back today on the chart, the 1987 41% collapse looks like a little blip. That is certainly not how it felt at the time, especially since it happened in a matter of days.
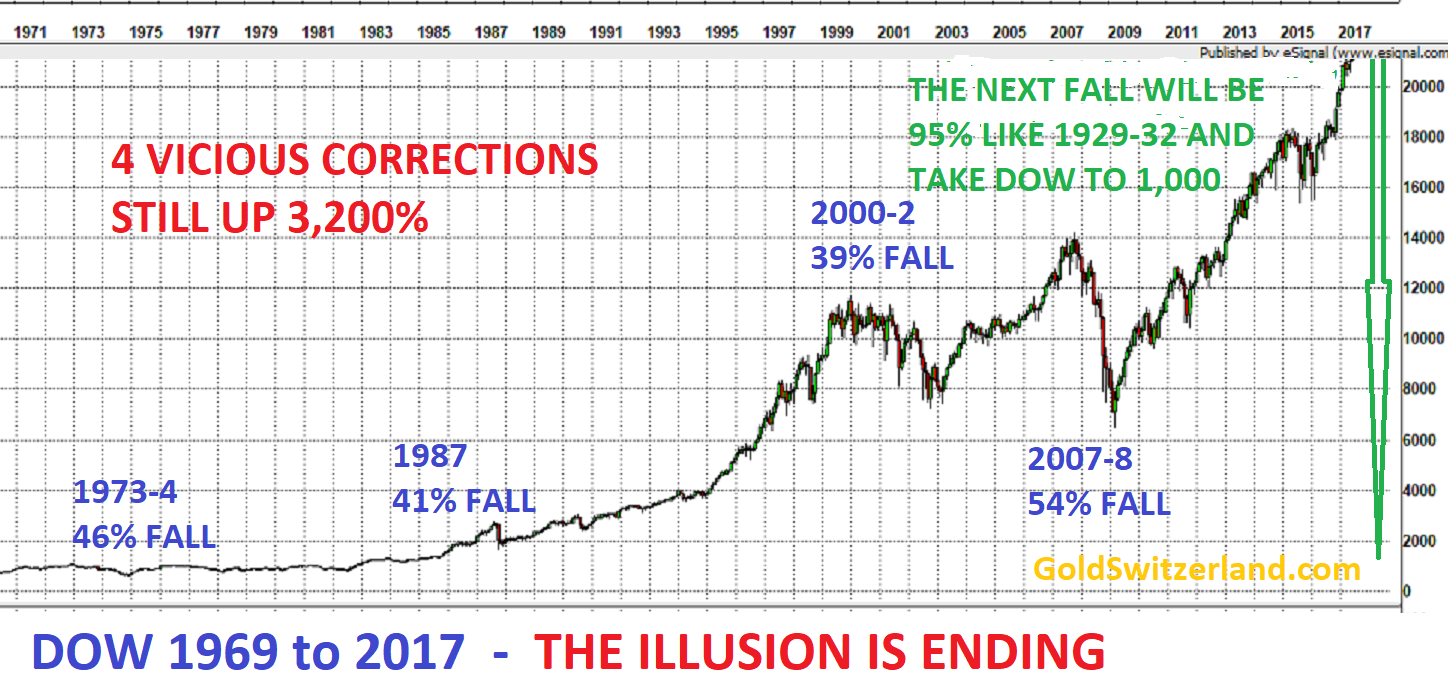
In spite of major drawdowns during the 1969 to 2017 period, the long term bull market in the Dow has continued until today when the money invested had multiplied 33X.
Back then in 1969 with the Dow at 700, if someone had said that I would experience the Dow at over 23,000 I would of course had said that’s ridiculous. Had I looked back 48 years from 1969, I would have found a Dow at 80. So the 48 years from 1921 to 1969 the Dow grew just under 9X or 4.5% per annum.
Thus based on history, the Dow should be 9X higher today than in 1969 or 6,300! So how is it possible that we are now seeing a Dow at over 23,000? Well, we have had the Wizards of Fake Money in the meantime who, with their hocus pocus, have created money out of thin air.
Debt has grown 2.5x faster than GDP
Little did I know in 1969 that Nixon two years later would change the destiny of the world for decades to come as the US came off the gold standard. By throwing off the shackles of a gold backed currency, there was no longer anything stopping the US government and the financial system from creating unlimited credit and printing infinite money.
The consequences have been a US and global credit expansion of gigantic proportions. Just in the US, credit has grown 47X from $1.5 trillion to $70 trillion.
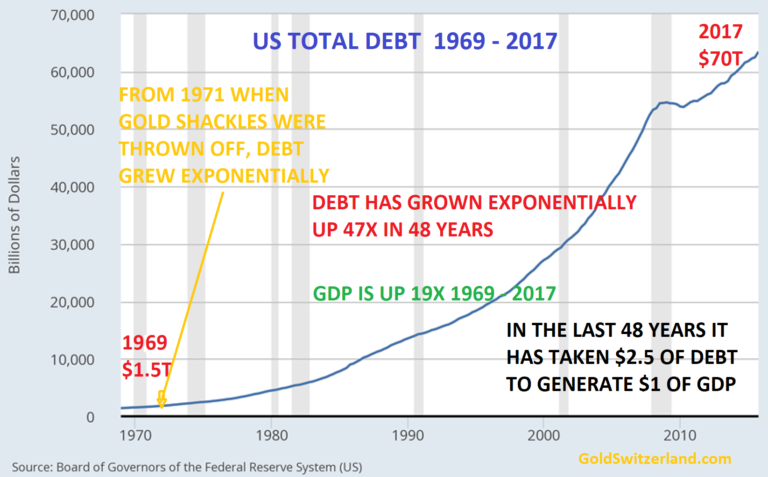
As the chart shows, more and more printed money is needed to grow GDP. The US is now running on empty. No wonder that stocks have gone up 33X since 1969. All this manufactured money has not benefitted the real economy. Instead it has gone to the bankers and the 1% elite.
Real GDP is down 8% since 2006
But if we adjust GDP for real inflation based on Shadowstatistics, it looks even worse. As the chart below shows, real US GDP has declined 8% since 2006 rather than the 16% increase that the official figures show.
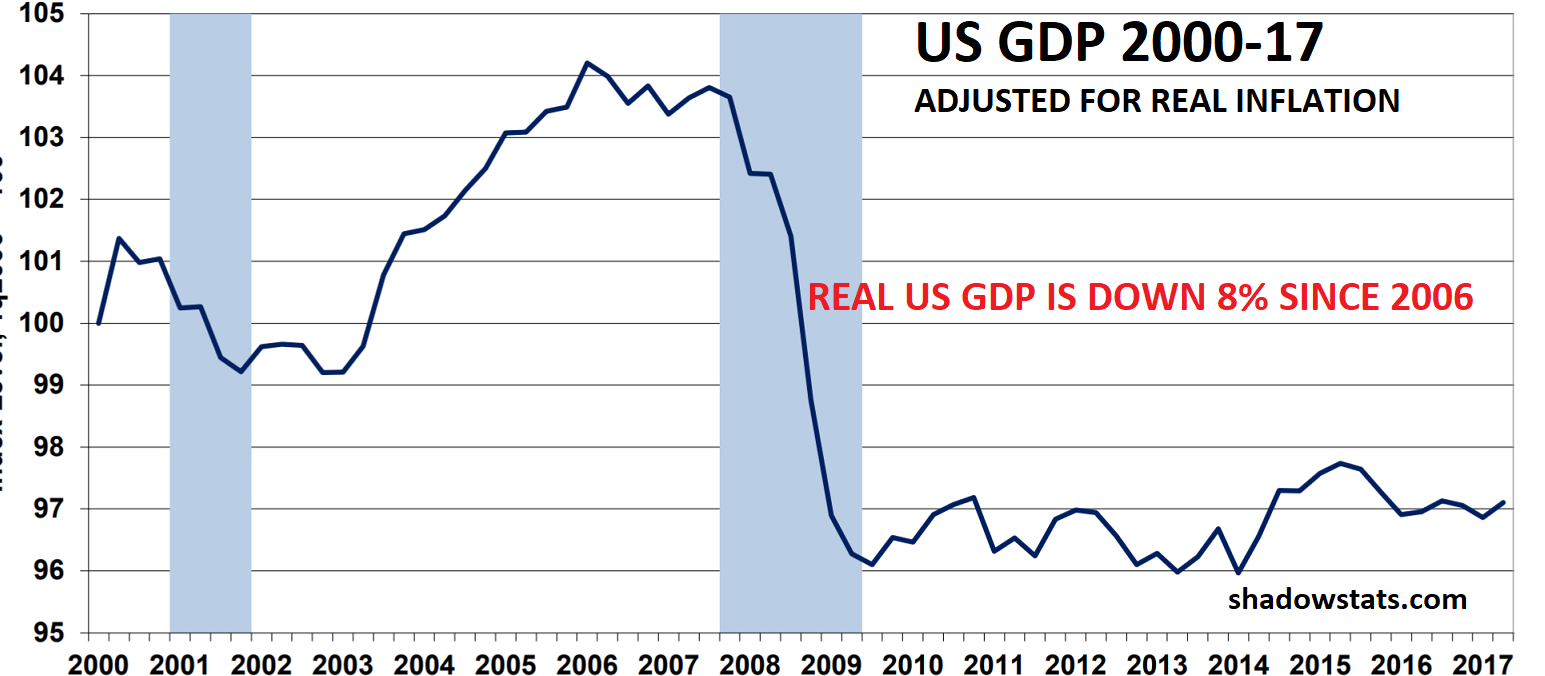
US total debt in 2006 was $45 trillion and is now $70 trillion, a 55% increase. If we compare that to the Shadowstats real GDP growth, we then have a 8% GDP reduction in the last 11 years against a 55% increase in debt. Thus, however much money the US prints, it no longer has an effect.
Based on the laws of nature, this makes total sense. If you print money which is not a substitute for a service or goods, it has zero value and cannot generate any growth in GDP. This has nothing to do with real money but is a certificate of fraud and deceit. The majority of the $2.5 quadrillion of debt, derivatives and liabilities outstanding today belong to that category.
Once the bluff of the world monetary system is called, all that $2.5 quadrillion will disappear in to a black hole together with all the assets that were inflated by this debt.
Gold to outperform all assets over next 10 years
Coming back to the question what the best investment is for the next 48 years, I have no idea. One thing is certain, gold will continue to preserve wealth and maintain purchasing power as it has done in the last few thousand years. It might not be the best investment for the next half a century, but it will certainly be a very safe investment.
But if we take the next 10 years, gold (and silver) is likely to vastly outperform most conventional assets like stocks, bonds and property. The Dow is now the most overbought it has been in over 60 years with gold and silver depressed by a fake paper market.
Gold has been in an uptrend for 18 years from 1999 with a 4 year correction ending in 2015. The uptrend has resumed and will soon accelerate with gold reaching at least $10,000 in today’s money. But we are likely to have funny money in the next few years as governments print 100s of trillions or quadrillions of dollars in their futile attempt to save the financial system. This will take the gold price to levels which seem unreal today whether that is $100s of millions or trillions. In real terms those levels are meaningless. What is more important is that gold will preserve purchasing power and save people from a total wealth destruction by holding bubble assets or money in the bank.
So to me it is totally clear that I would advise everyone who has capital to preserve to put it into gold today. This is also the best gift to give to your children and grandchildren as long as they save the gold for at least 5 years or longer.
Dow to fall 97% against gold
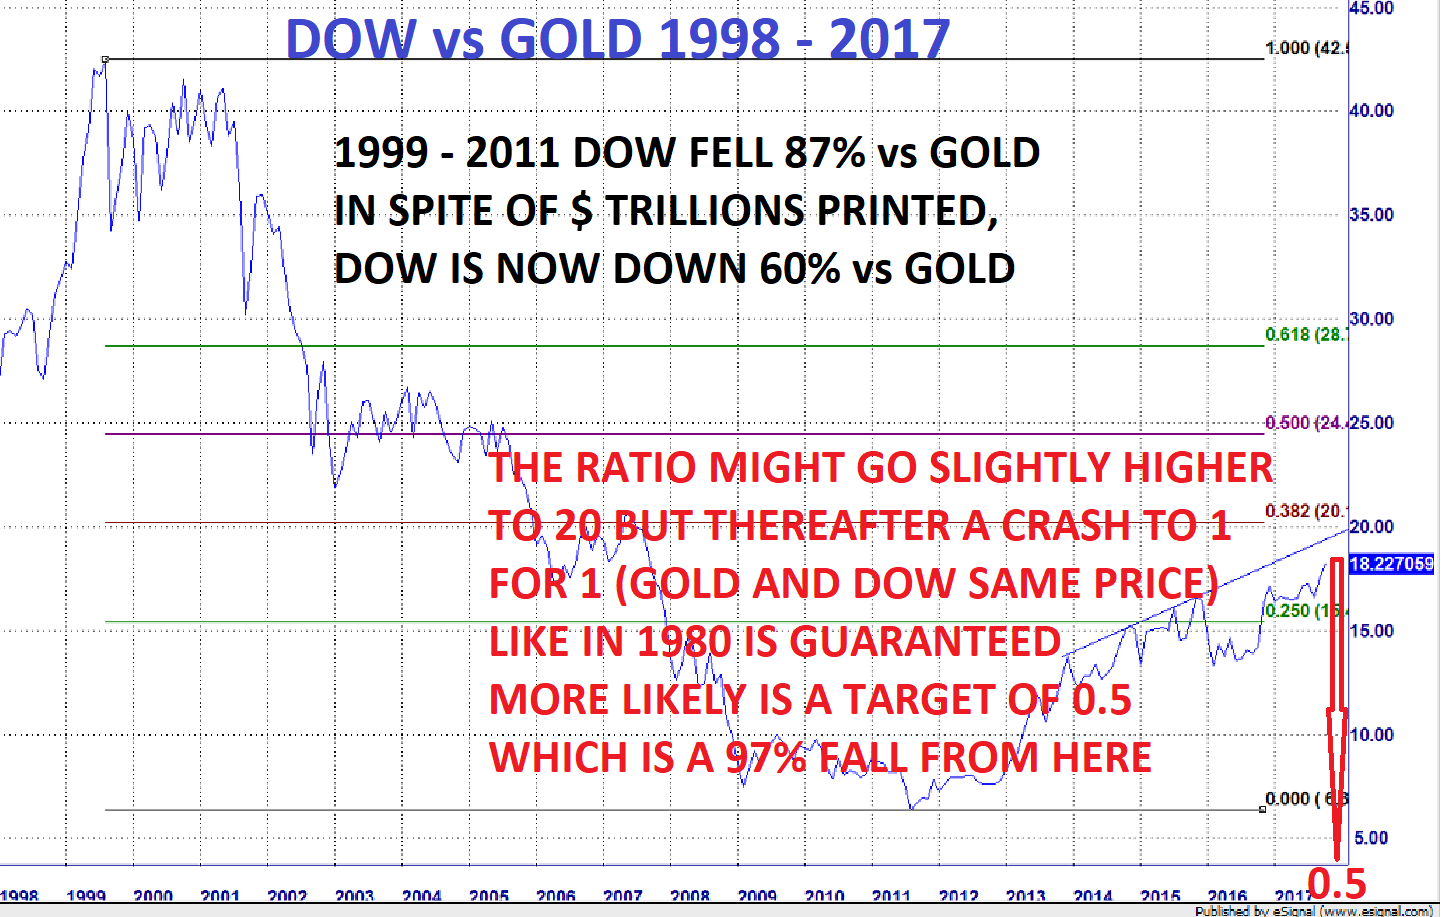
Finally, the chart which confirms that this is a unique point in history to turn a massively overvalued stock market into the best wealth preservation insurance that anyone can buy.
The Dow / Gold ratio crashed by 87% from 1999 to 2011. After a weak correction, the ratio is still down 60% since 1999. Thus, gold has vastly outperformed the Dow over the last 18 years.
The current correction up of the ratio could go slightly higher but it is now very stretched and the downside risk is massive. I expect the ratio going below the 1980 level of 1:1 and probable overshooting to 0.5. That means a further fall of the Dow against gold of 97%.
Most major stock markets around the world are now more overbought than ever in history. Exponential moves of this nature can extend but when it turns, the move down is likely to come out of the blue, like in 1987, and be very fast and extremely punishing.
Thus, the decision is really easy. The risk of holding bubble assets like stocks, bonds and property is now at a historical extreme. The easy and correct contrarian investment is to hold gold (and some silver). This will not only save investors form total wealth destruction but also create incredible opportunities to buy bombed out assets with the gold at 3 cents on the dollar.
Investors must not miss this opportunity of a lifetime.
Original source: Matterhorn - GoldSwitzerland
Reproduction, in whole or in part, is authorized as long as it includes all the text hyperlinks and a link back to the original source.
The information contained in this article is for information purposes only and does not constitute investment advice or a recommendation to buy or sell.


