We know that central banks and governments have lost the plot. When the crisis started in 2006, US short rates were 5%. In 2008 they were down to zero and have virtually stayed there ever since. A crisis package of $25 trillion was thrown at the financial system. This is what the likes of JP Morgan and Goldman told the Fed they had to do to save the bank(-ers). Ten years later the world financial system is in a mess that is exponentially greater. World debt has exploded, most governments are running deficits and the financial system is balancing dangerously on the edge of a precipice. $8 trillion of government debt is now negative and $16 trillion is below 1%.
Negative yields are supposed to stimulate a deflationary global economy and also save bankrupt nations which can’t afford to pay a market interest rate on their exploding debts. But as usual, the central bankers have got it wrong again. Negative rates are increasing the risks for the financial system and the world economy. Bank profitability is crashing due to the low rates and forces them to take greater risks. For savers it kills the incentive to save. And without savings, there will be no investments and no growth in the economy. But the biggest disaster is hitting the pension sector. Virtually all pension funds are seriously underfunded, especially if they applied realistic rates of return. Pension funds hold three principal investments, stocks, bonds and property. These are all bubble assets inflated by the credit explosion in that central banks have orchestrated. As these assets implode, there will be no pensions left for anybody. People who are about to retire in coming years have no understanding of the fate that is going to hit them. They will receive no pension or a pension that is worthless. As the economy deteriorates, the unemployment rate will also rise dramatically. The combination of retirees with no pension and a high percentage of the population without a job will lead to severe human disasters around the world. Governments will of course print unlimited amounts of money but this will have no effect as manufactured money can never create wealth.
This is all the result of central banks interfering in the natural cycles of the economy by financial repression and thus interfering with nature’s law. So instead of having minor booms and busts, the manipulation of markets and the economy creates the most massive super booms and busts. It is of course not the first time it happens in history and it will continue to happen. It will sadly lead to a period of very difficult adjustments and misery for current generations and possibly even future ones.
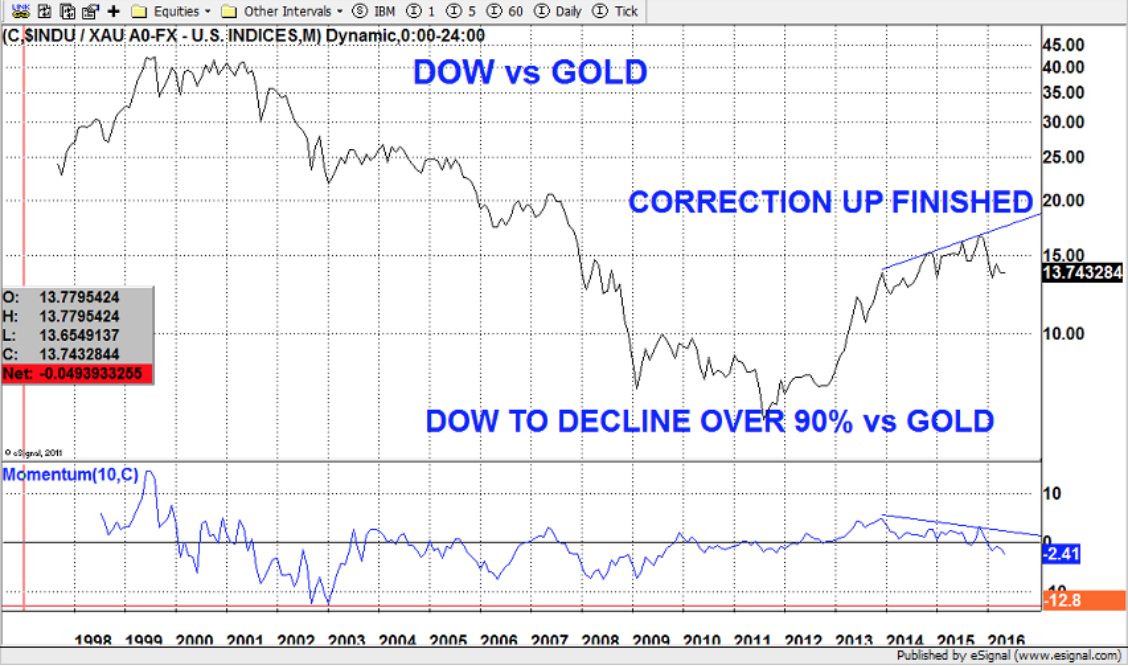
In addition to all the negative fundamental factors, there are certain indicators that are telling us that we are now getting nearer to the next phase of the downturn that started in 2006 and which has had a temporary reprieve. I have previously talked about the importance of the Dow Gold ratio. This ratio peaked in 1999 when the Dow was at a high and Gold at the $250 low. The ratio then declined by 87% until September 2011. This means that the average investor in the US stock market was a massive 87% worse off compared to owning gold instead. Between 2011 and the end of 2015, the ratio recovered 25% of the fall since 1999. Technically it is very clear that the dead cat bounce in this ratio is now finished and that it is on the way to new lows. Since December last year the Dow has fallen 18% against gold. Eventually I see the ratio going well below the 1 to 1 ratio in 1999 (Dow 800 and Gold $800). But even if the ratio only went to 1 that would mean a fall of the Dow versus gold of 92% from here. So gold in the next few years will not only preserve investors wealth but also enhance it. Holding stocks on the other hand will not only lead total despair but also to total wealth destruction.

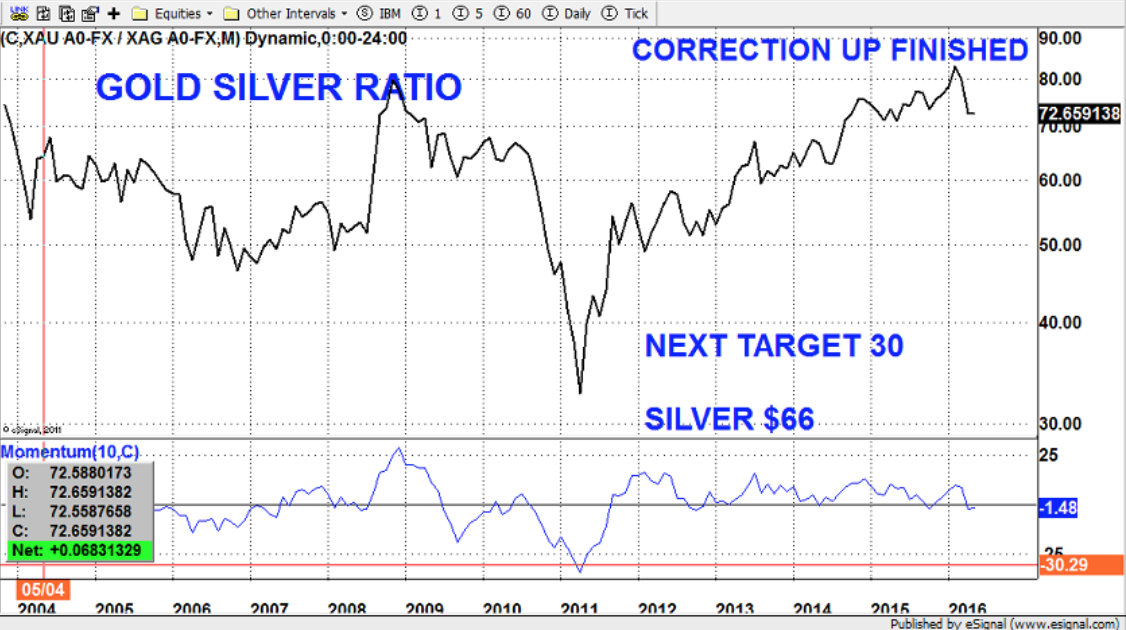
Another indicator which tells us that the bull market in the precious metals has now resumed is the Gold Silver ratio. Normally silver leads the move in trending metals’ market. This is what happened in the 1970s when gold peaked at $50 in 1980. It also happened in 2011 when silver again reached $50 and rose more than two times as fast as gold over a 12-month period. The ratio bottomed at 30 in 2011 and went back all the way to 83 in February this year. This is an important resistance level and several technical indicators gave a strong signal that the correction finished at that level. Since then the ratio has lost 13% which means that silver is leading the move up of the precious metals. Within the next year or two the ratio should again reach 30 which means that silver will go up twice as fast. Eventually we could see a move to the important historical level of 15. The resumption of the downtrend in the ratio gives us two important messages: Firstly, that silver will vastly outperform gold and secondly that the metals are now on their way to new highs. But investors most remember that silver is extremely volatile and it is a lot easier to sleep at night by holding more gold than silver.

It looks like 2016 will be a year when volatility increases dramatically in the world. Not only are the risks now greater than ever in the world economy as I have discussed many times, but the geopolitical risk is now more serious than it has been for many decades. The US and its allies have created anarchy in Afghanistan, Iraq, Libya and Syria with serious repercussions for world security. There are many other areas that could lead to major war(s) such as Ukraine, Saudi Arabia, North Korea and China (South China Sea). And as we know from history, bankrupt empires often start wars as a final act of desperation. Let’s hope that this doesn’t happen although we must be aware that the risk is major.
Original source: GoldSwitzerland
Reproduction, in whole or in part, is authorized as long as it includes all the text hyperlinks and a link back to the original source.
The information contained in this article is for information purposes only and does not constitute investment advice or a recommendation to buy or sell.


