At first glance, the US employment figures released for July 2025 appear solid. The unemployment rate remained stable at 4.2%, and casual observers might see this as a sign of economic resilience. However, a closer look at the data from the Bureau of Labor Statistics reveals a much more worrying reality.
First, the number of people employed declined: the US lost 260,000 jobs in one month, falling from 163.366 million in June to 163.106 million in July. This decline comes as the total population continues to grow (+200,000 people over the period), meaning that the labor market is unable to absorb new entrants. At the same time, the labor force participation rate fell to 62.2%, continuing a worrying trend. This level remains well below pre-pandemic levels, revealing growing disengagement, particularly among young people and seniors.
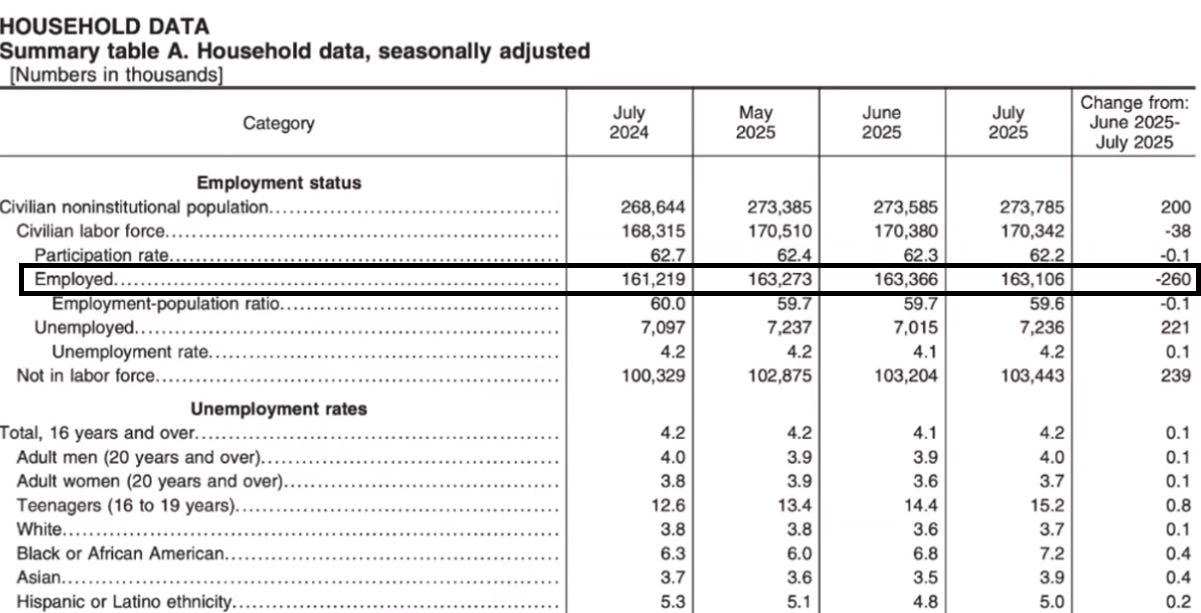
Another worrying sign is that the number of unemployed people is rising sharply (+221,000 in one month), without affecting the apparent unemployment rate. This paradox can be explained by an even greater increase in the number of people who are simply leaving the labor market. These “invisible” people are no longer counted as unemployed because they are no longer actively seeking work. In July, their number reached a record high: more than 103.4 million Americans of working age were no longer part of the labor force.
Finally, certain segments of the population are disproportionately affected. The unemployment rate for teenagers (aged 16–19) stands at 15.2%, up from 12.6% a year earlier. Among African Americans, it has climbed to 7.2%, an increase of 0.6 percentage points in one month. These figures illustrate how deeply entrenched structural inequalities and social tensions remain in the US labor market.
In conclusion, far from being a sign of economic strength, these figures reflect growing structural fragility. The US economy is no longer creating enough net jobs, while many workers are dropping out of the system. The apparent stability of the unemployment rate actually masks a deterioration in employment dynamics. Since March 2025, the US has lost more than one million jobs according to the household survey — a worrying figure that is at odds with the official narrative. The enthusiasm surrounding these figures should therefore be viewed with considerable caution.
The latest US employment figures, which fell well short of expectations, have radically altered market expectations regarding the Federal Reserve's key interest rate path. A majority of economists – 70 out of 100, according to a recent survey – now expect two 25-basis-point rate cuts by the end of the year, in September and December. The prospect of faster and more significant monetary policy easing is giving a boost to financial markets, which had recently been shaken by uncertainty about the strength of the real economy.
But this return of stock market optimism is not based solely on expectations of lower rates. It is also fueled by the massive influx of liquidity injected through record issuances of very short-term US Treasury bills. On July 25, the Treasury raised $90 billion through four-week T-bills, already a high figure. Less than two weeks later, on August 5, a new historic record was set with an auction of $100 billion for the same maturity, a first in US financial history.
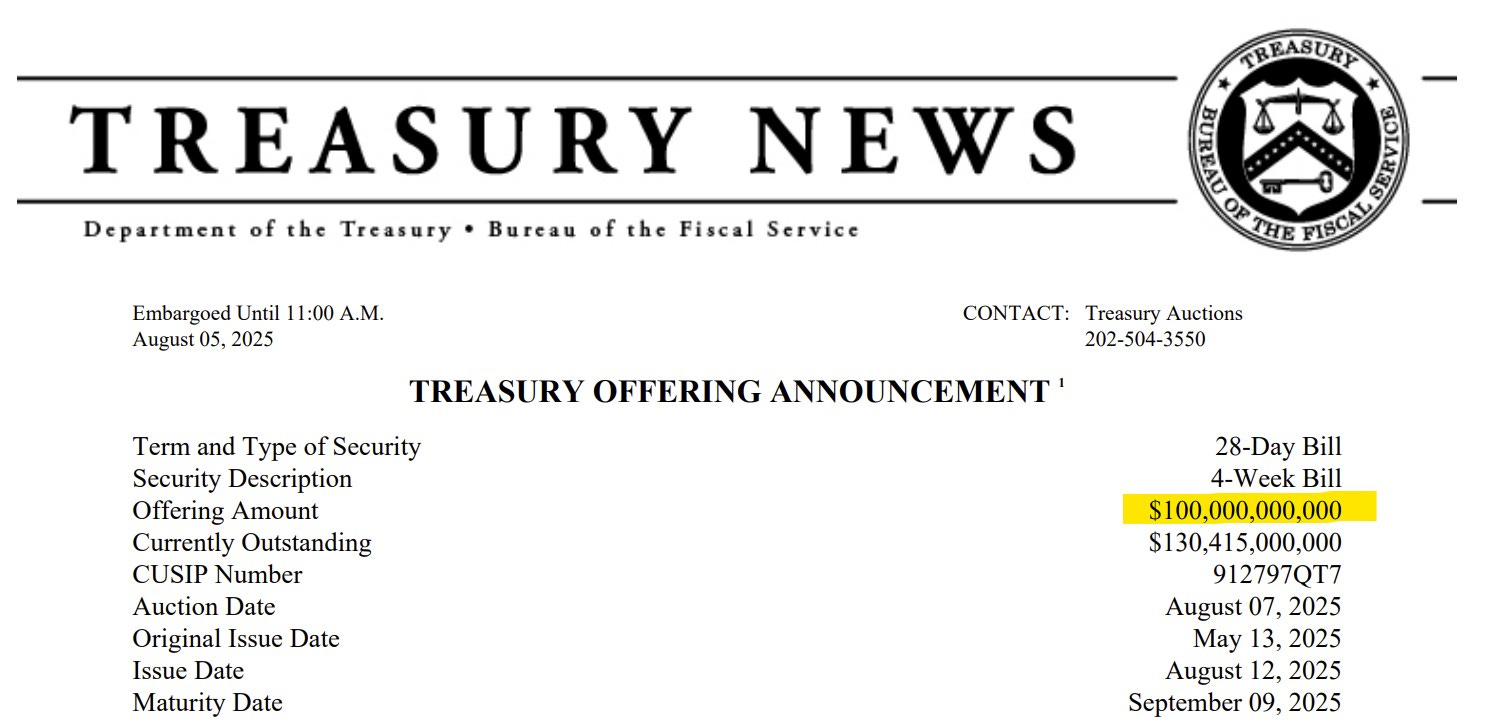
This avalanche of very short-term debt securities is helping to temporarily stabilize markets by maintaining the illusion of liquidity and responding to strong demand for monetary instruments. However, this strategy is not without risk: it reinforces markets' dependence on ever shorter and more massive public financing, in a context of budgetary constraints.
The liquidity injected by massive T-bill issuance appears to be flowing into an increasingly concentrated stock market. Last week, investors poured $14 billion into US large-cap stocks, putting this segment on track for annual net inflows of $419 billion, which would be the second-highest year on record for capital inflows.
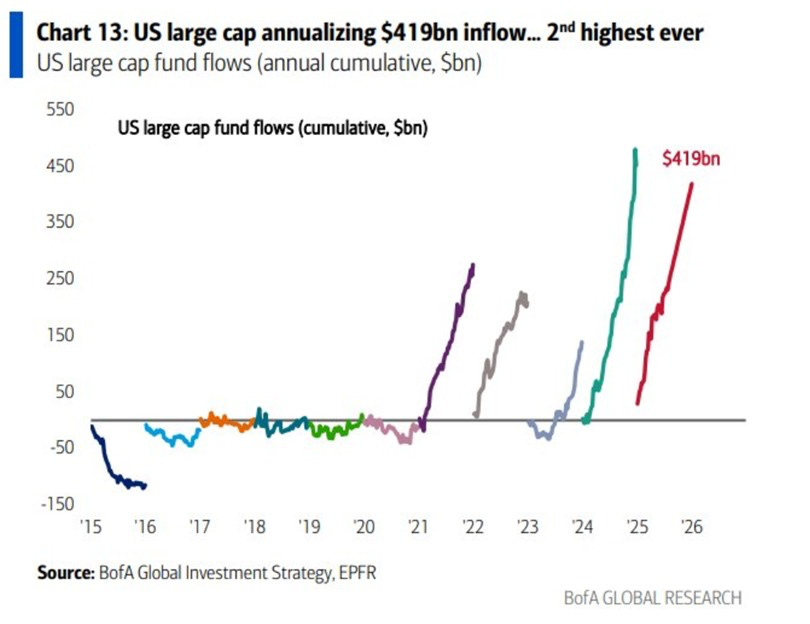
Conversely, small caps saw a surge with $4.5 billion in net inflows for the week. But this one-off rebound is not enough to reverse the underlying trend: for 2025 as a whole, small caps remain on track to see net outflows of $80 billion, a historic record for disengagement.
Overall, US equities as a whole are projected to see annual inflows of $286 billion, which would make this the third best year in terms of net inflows into US equity markets. This movement reflects a clear phenomenon: capital is flowing heavily into US equity markets, but it is doing so in a highly selective manner, increasingly favoring stocks perceived as the safest, most liquid or most dominant.
This growing polarization, where large caps capture most of the flows, accentuates the structural fragility of the markets: the rise in indices actually masks an extreme concentration of performance in a few flagship stocks, while more cyclical segments or those exposed to financial constraints (such as small caps) continue to suffer.
In addition to being extremely concentrated, the US market is also particularly expensive. The chart published by Goldman Sachs confirms this: the forward P/E ratio of the S&P 500 is currently 22x, a historically high level. In other words, investors are willing to pay $22 for every dollar of expected earnings, reflecting a stretched valuation and very ambitious growth expectations.
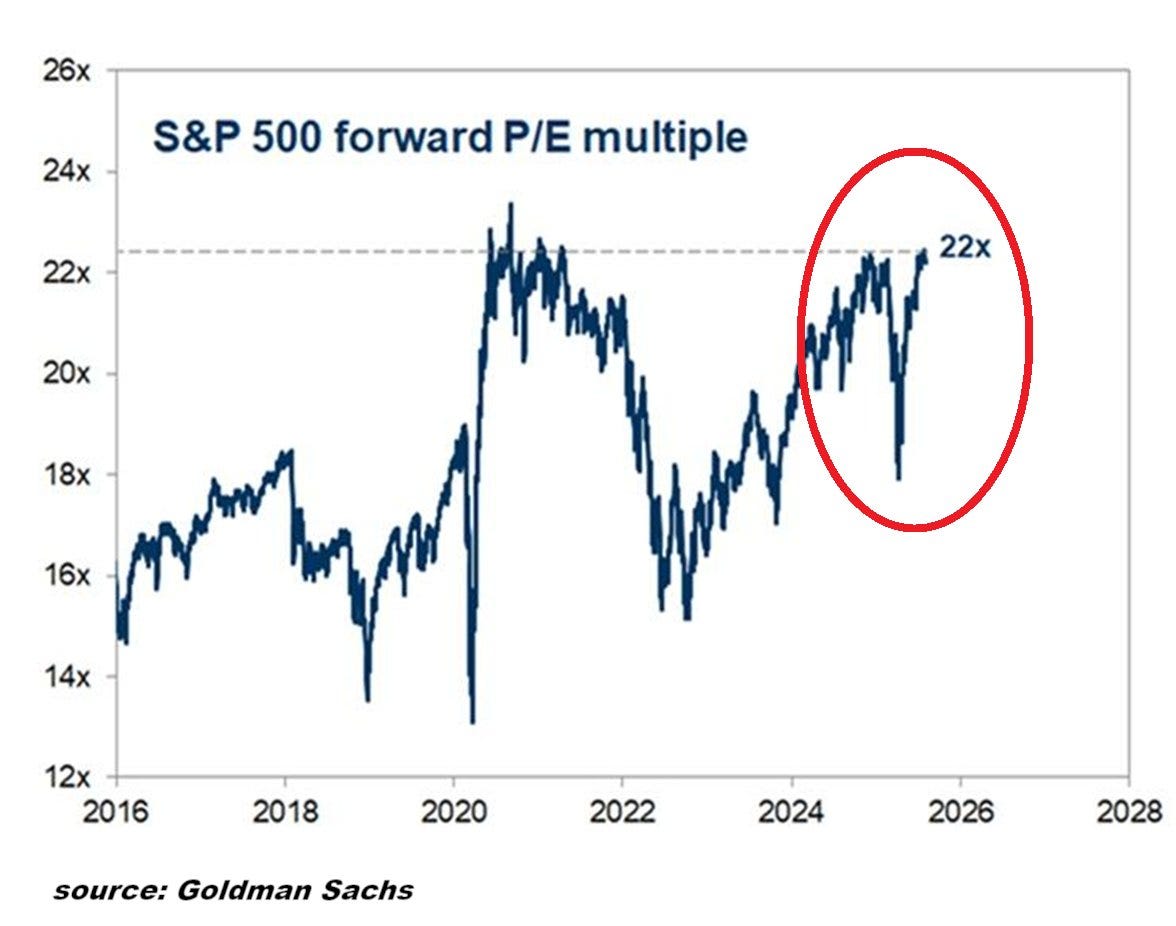
Apart from the exceptional episode of 2020-2021, stimulated by zero interest rates and massive stimulus measures, the valuation multiple rarely remains this high. However, the current environment is very different: real interest rates are now positive, the Fed has not yet begun its cycle of rate cuts, and macroeconomic uncertainties persist.
The current massive injections of liquidity — in the form of disguised “fiscal QE” via the record issuance of very short-term T-bills — are like kindling: they quickly inflame the market without providing any lasting warmth. This frenzy of 4- or 8-week refinancing, involving unprecedented amounts ($90 billion then $100 billion for 4-week T-bills in the space of ten days), is artificially fueling demand for risky assets, particularly large-cap technology stocks.
But just as crates burn quickly without leaving embers, this form of temporary support creates neither structural growth nor financial resilience. It masks the reality of a slowing economy, a weakening labor market, and a valuation bubble that is increasingly difficult to justify.
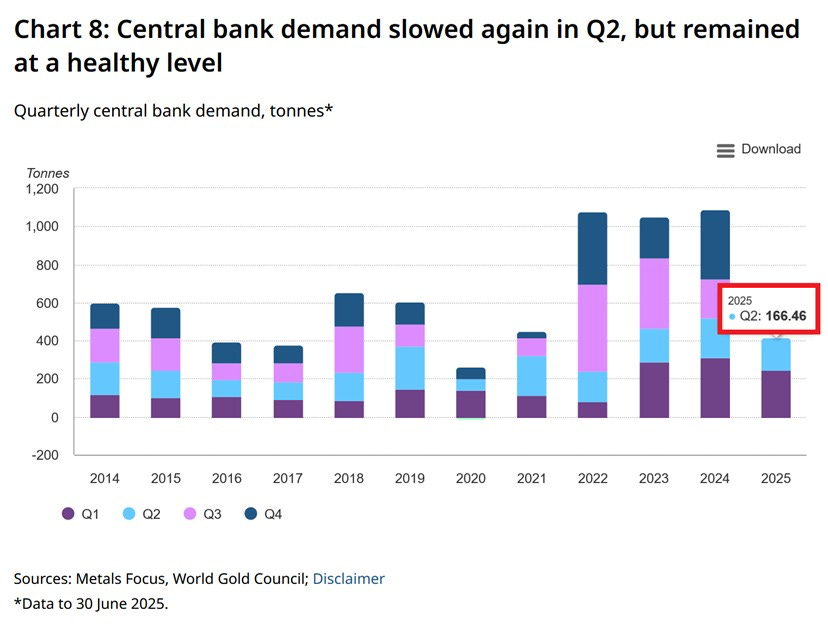
The US situation is heightening the risks for foreign holders of dollar-denominated assets. Against a backdrop of excessive valuations, artificial liquidity injections, and growing signs of macroeconomic fragility, confidence in US fundamentals is gradually eroding. It is in this climate of uncertainty that we are seeing the continuation — even normalization — of gold stockpiling by central banks, despite a steady rise in prices.
The latest report from the World Gold Council confirms this trend: central banks purchased 166.46 tons of gold in the second quarter of 2025, which is lower than the record levels seen in 2022–2023 but still historically high. This figure is part of a structural trend toward diversification away from the dollar, which began after the 2008 crisis and has intensified since 2022 with international financial sanctions. Purchases are continuing at a steady pace, revealing strategic, non-speculative demand, driven primarily by financial and geopolitical resilience objectives.
This quiet but steady movement reflects a strong conviction: central banks — particularly those in emerging countries — are preparing for a world where the dollar will no longer be the only credible store of value. As monetary uncertainty grows, gold is regaining its central role as a trusted asset that is outside the system, liquid, and free of counterparty risk.
This rush for physical gold has been accompanied in recent weeks by a similar movement in silver.
Data published on Monday by COMEX points to an unprecedented event: nearly 290 million ounces of silver were withdrawn from “eligible” stocks in a single day. This represents 91.9% of the entire category, a record level that illustrates the growing tension in the physical market for the white metal.
While these ounces are not necessarily intended for immediate delivery (unlike so-called “registered” stocks), such a massive movement reflects a clear strategy of security: some players seem to want to withdraw from the clearing system and regain direct control of the metal.
Another strong signal: physical demand in August 2025 exploded compared to the previous year. In just four days, 1,469 silver futures contracts entered the delivery phase, compared with 1,035 for the whole of August 2024. This represents a 42% increase year-on-year, a tangible sign that something is changing in the behavior of contract holders.
Faced with this situation, traditional paper market operators could seek to step up their defensive strategies: pressure on prices, increased short selling, or communication campaigns aimed at containing investor nervousness. However, the scale of the withdrawal and the rapid rise in delivery requests suggest a structural imbalance that will be difficult to hide for much longer.
This phenomenon comes at an already fragile time: COMEX stocks have been falling steadily for several months, logistical tensions persist, and there is renewed interest in physical metals as a hedge against monetary instability.
Without announcing an imminent delivery default, this series of signals calls for a reassessment of the robustness of the link between the derivatives markets and the physical market. The sharp rise in withdrawals and physical delivery requests is now putting pressure on COMEX — with potentially lasting implications for price formation.
Reproduction, in whole or in part, is authorized as long as it includes all the text hyperlinks and a link back to the original source.
The information contained in this article is for information purposes only and does not constitute investment advice or a recommendation to buy or sell.


