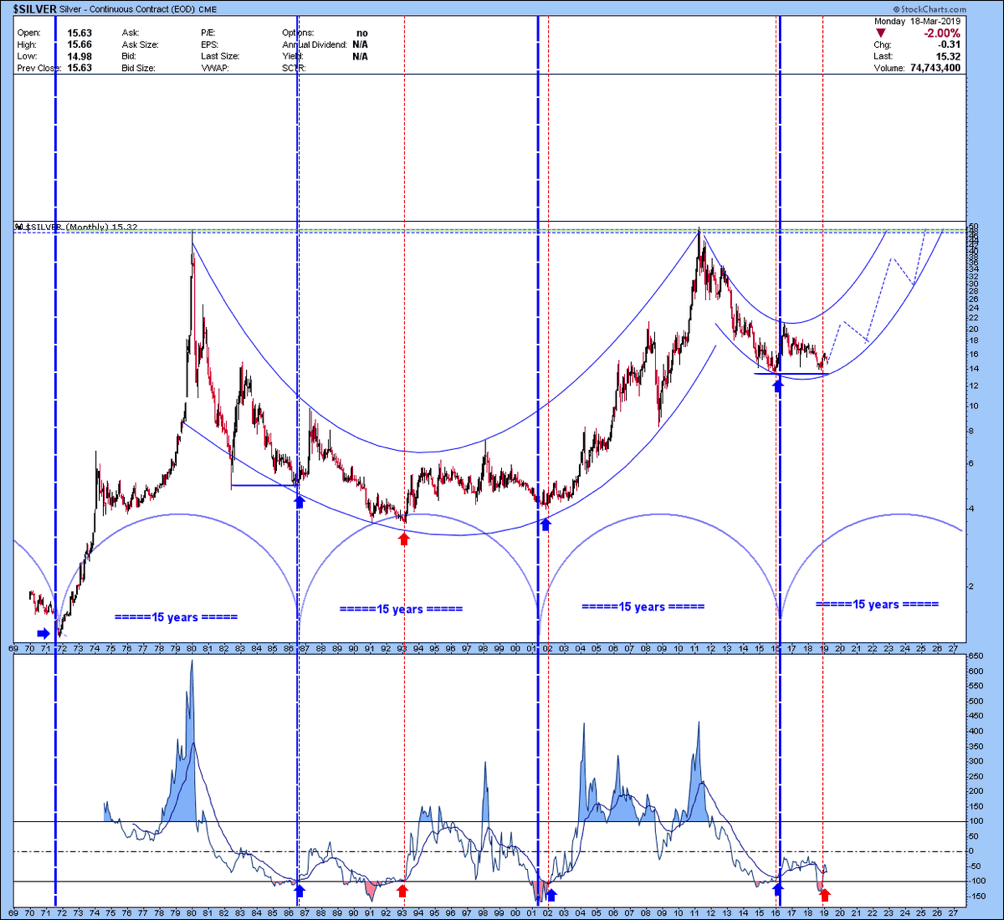
Starting from the data of the ‘70s, it is possible to elaborate a graph (on a logarithmic scale) that highlights a huge cup with a handle and that respects a cycle of minima every 15 years.
As for gold, even for silver it is possible to make the 15-year cycle, starting from 1971: here we had the lows of 1986, 2001 and 2016. Using the lower indicator we can also see that the upward exit from oversold (with the average cut from bottom to top) supports the cyclical minimum theory.
It is clear that keeping the minimum between 2016 and 2018 is fundamental for this theory to remain valid: the next upward leg will therefore be seen as confirmation of this enormous bullish figure.
Reproduction, in whole or in part, is authorized as long as it includes all the text hyperlinks and a link back to the original source.
The information contained in this article is for information purposes only and does not constitute investment advice or a recommendation to buy or sell.


