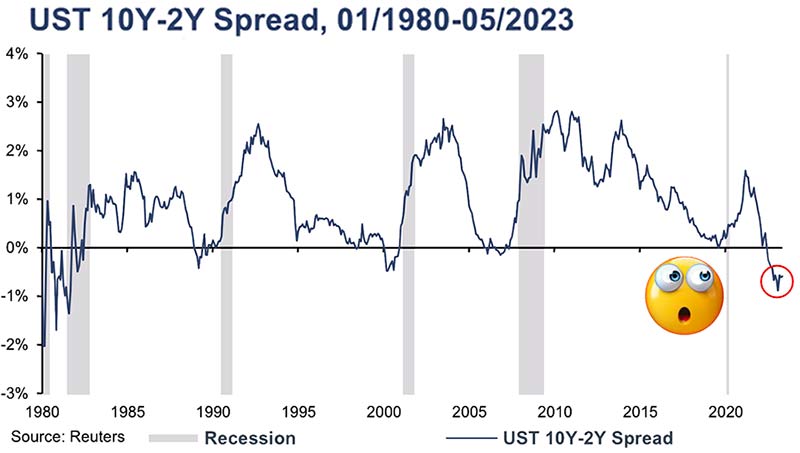
A negative 10-2 Year Treasury Yield Spread has always been considered a precursor to a period of recession.
A inverted yield curve predicted every recession from 1955 to 2018, but occurred 6 to 24 months before the recession happened. It is therefore considered a leading indicator.
This yield spread has been in negative territory since July 2022.
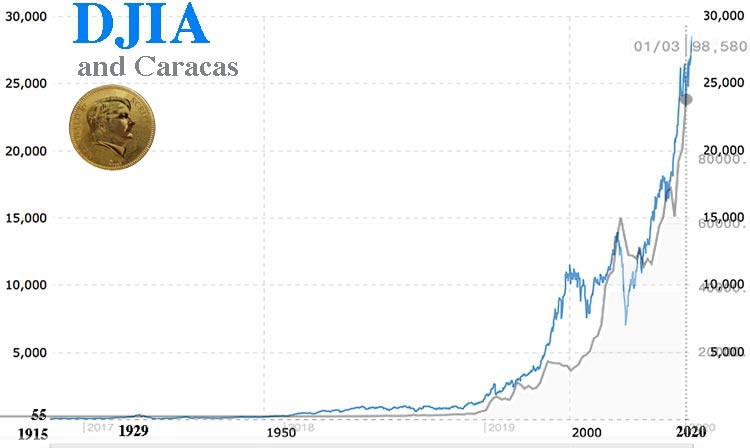
Bursatil, the Caracas Stock Exchange index reached 125 points on January 3, 2012. On October 5, 2017, it rose to around 550,000 points. On October 17, 2017, the same index was reduced to 1,200 points, but the November 2, 2018, it had risen again to 505,000 points. A few days later, it was reduced once more to 1,000 points, before exceeding 2,465,000 points on December 3, 2021.
Of course, it is a problem of the Venezuelan monetary hyperinflation. With the Bolivar devaluing at breakneck speed against all currencies, the stock market compensates by re-evaluating companies as if they were gold or a tangible asset. The Venezuelan government is forced to print new banknotes with more and more zeros, because after a few days nothing can be bought with the old banknotes.
I have already drawn the parallel with the Dow Jones, whose index value is correlated to the money supply and the real value of the dollar.
Let's take a pictorial detour:

In 1972, a carambar was 10 cm long and was worth 5 centimes of french francs.
In 2022, a carambar was 8 cm long and was worth 0.15 euro equivalent of 1 french francs.
In the 1960s, Carambar sold 300 million caramel bars, today they are selling 900 million caramel bars.
The only reality is the number of Carambar sold since there was a change of monetary unit from the franc to the euro, and the euro itself has since experienced a very strong monetary erosion, since one ounce of gold was worth 302 euros in June 2000 and was worth €1,832 on June 7, 2023. Its purchasing power has been divided again by 6.
It is exactly the same with the American Gross Domestic Product.
On the chart below from the Fed, we see the money supply in red, which has soared since 1972.
You can see that the Gross Domestic Product followed in parallel.
If we only look at the GDP, we can marvel at the dynamism of the American economy, whose GDP is rising every year, right?
But if you divide the GDP by the money supply (M2) injected by the Fed by thousands of billions of dollars, it's a disaster!
What is even more interesting is that the Fed stops the chart on September 1, 2021, proof that it is better to hide the reality.
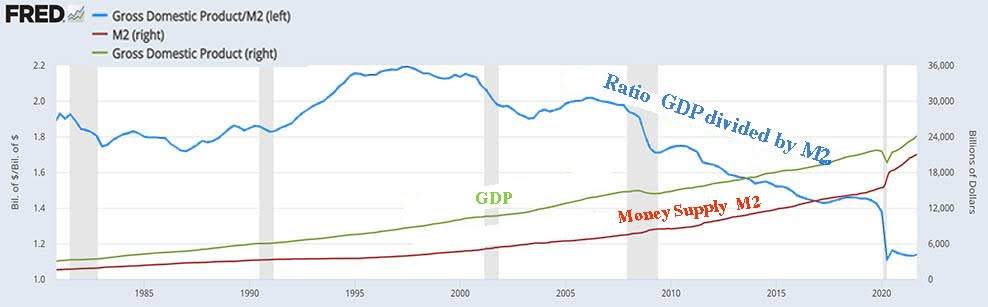
In reality, therefore, the American economy has been falling since the end of the 1990s.
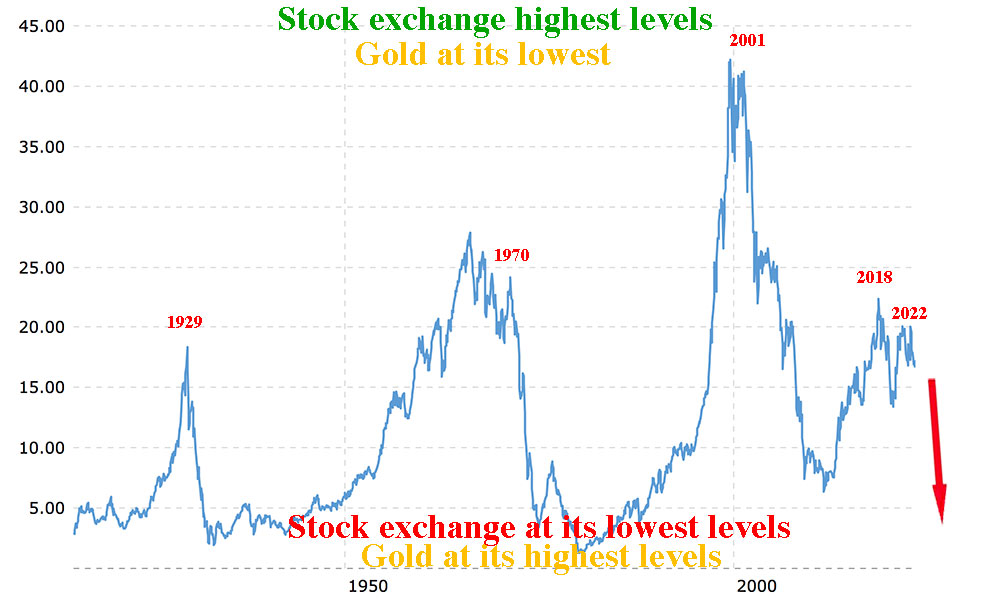
It's the same for the stock market!
Despite the apparent rise in the stock market, the Dow expressed in grams of gold has been falling since the low point of gold in 1999.
Given the rise in interest rates, which is leading to the bond, banking and real estate crisis and the very serious geopolitical crisis, which is leading to a global monetary crisis, do not be fooled by the upheavals of the stock market. A currency devaluation is essential and now IMMINENT.
So be patient just for a few more days! It's almost time for gold and silver to shine more than ever.
Reproduction, in whole or in part, is authorized as long as it includes all the text hyperlinks and a link back to the original source.
The information contained in this article is for information purposes only and does not constitute investment advice or a recommendation to buy or sell.


