Silver continues to put in a laggardly performance relative to gold, but this is not a cause for concern, it is normal at this stage in the cycle, and it gives would be investors in the sector more time to position themselves.
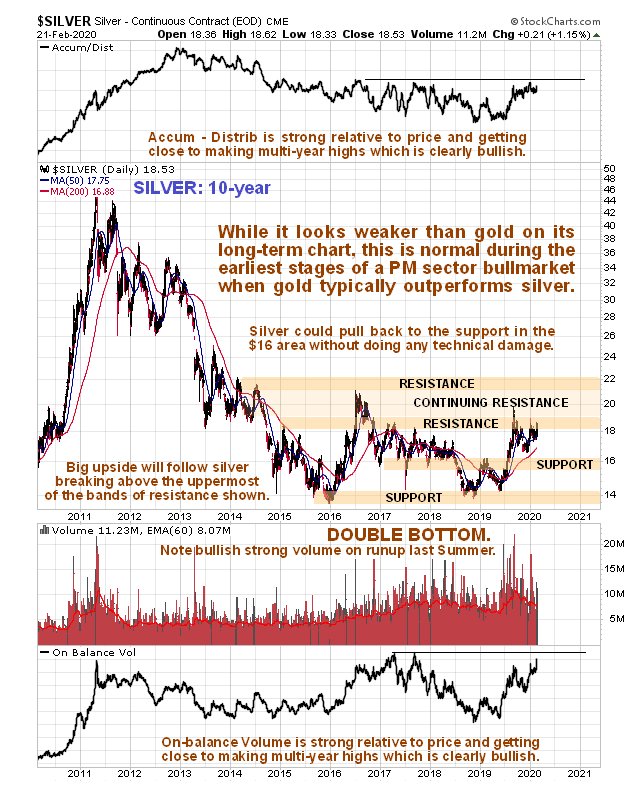
On its latest 10-year chart we can see that it is rather remarkable that silver is still only $4 to $5 above the lows of its bearmarket late in 2015 and early in 2016. However, with gold now romping ahead, this is not a situation that we can expect to continue for much longer. Positive points to observe on this chart are how silver is now advancing away from the 2nd low of a giant Double Bottom on strong volume that is driving its volume indicators higher, which is clearly a positive sign, and with moving averages now in strongly bullish alignment, it is well positioned to work its way through the bands of resistance shown that until now have held it in restraint, and that is what it is doing. Once it gets above the uppermost of the resistance bands shown it should accelerate, although it will then have to contend with resistance at and above the $26 level.

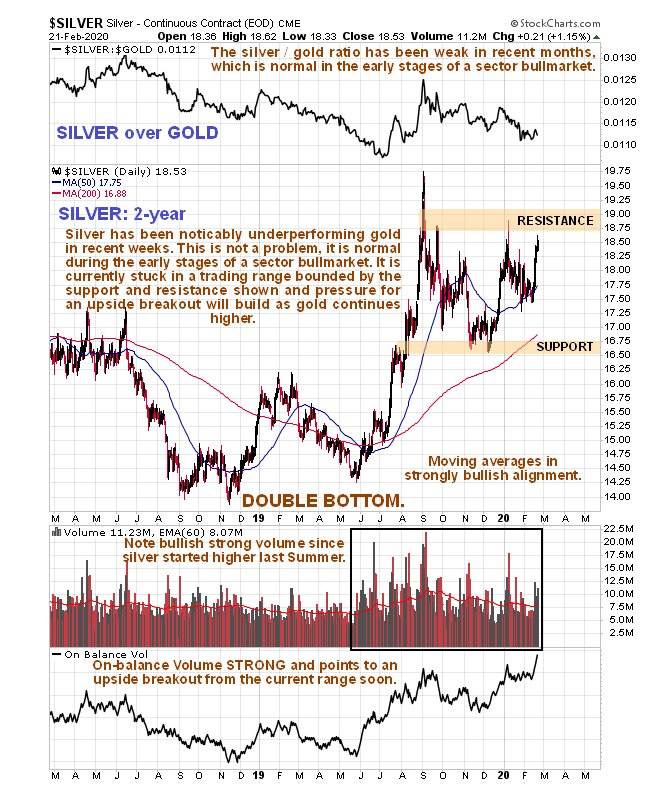
On the 2-year chart we can see the sharp advance out of the 2nd low of the Double Bottom last Summer, which itself is actually made up of a lower order Double Bottom, and how this has been followed by a lengthy period of consolidation that has allowed the 200-day moving average to largely catch up with the price. Silver has underperformed gold in recent months, as shown at the top of the chart, which is normal during the earliest stages of a major sector bullmarket, but On-balance Volume is strong, which bodes well for continued improvement, and it looks like it is building up to break out upside from the large consolidation pattern before much longer.

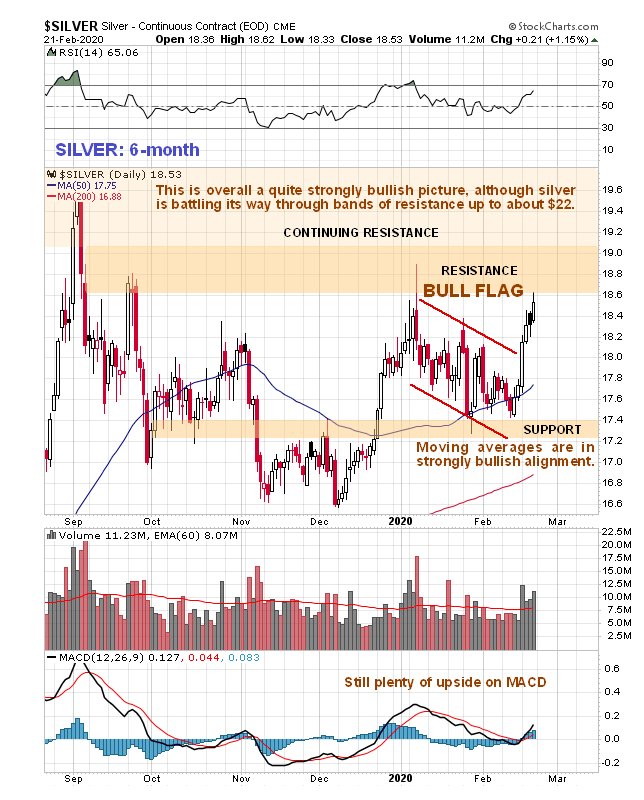
On the 6-month chart we can see how silver broke out of a smaller bull Flag to take off higher a few days back. While it could continue higher for a while it is getting short-term overbought and running into resistance at a time when its COTs are showing rather extreme readings, so we shouldn’t be surprised to see it stop for a rest, probably after some further upside.

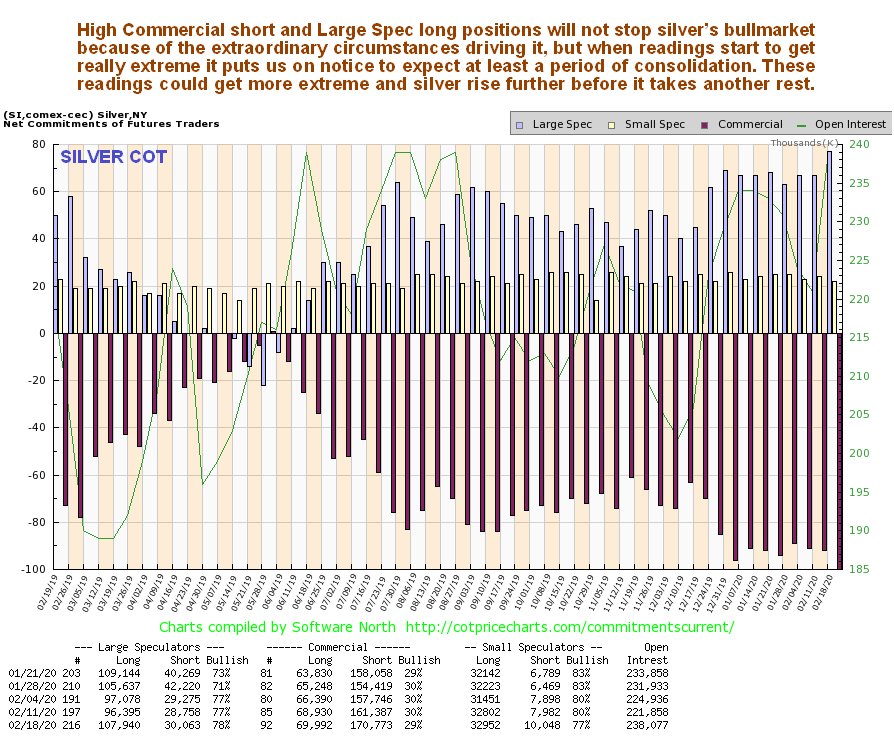
Although silver’s latest COT may be initially concerning on account of the high Commercial short and large Spec long readings, we should keep in mind that in the environment that we are entering readings are likely to stay high, and may get even higher. The main value of this chart is that when it shows really extreme readings it means that the risk of correction / consolidation is high, and it is approaching that state now, which is hardly surprising given the sharp rally of the past week or so.

Original source: Clivemaund
Reproduction, in whole or in part, is authorized as long as it includes all the text hyperlinks and a link back to the original source.
The information contained in this article is for information purposes only and does not constitute investment advice or a recommendation to buy or sell.


