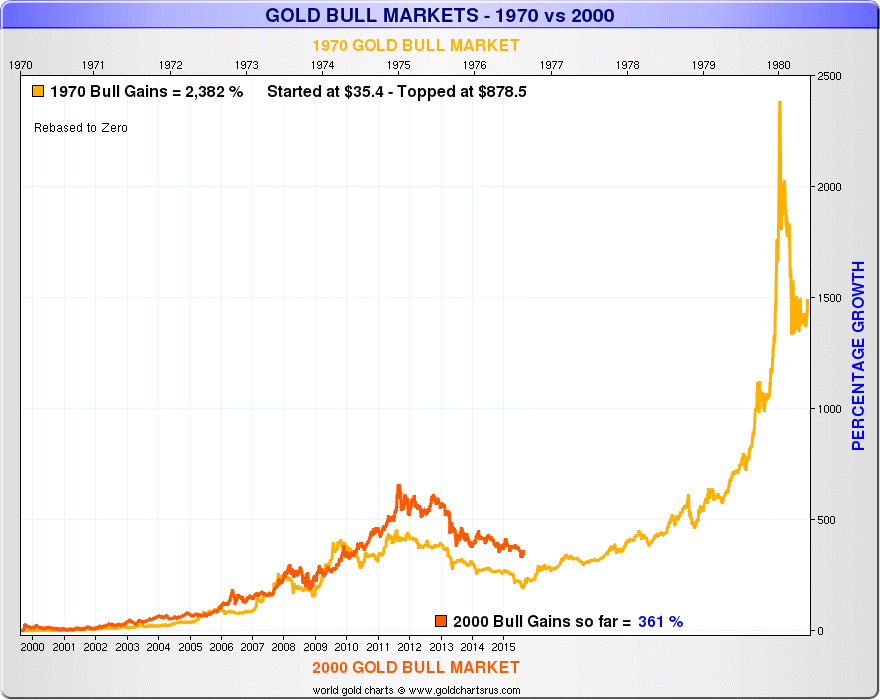
It is my contention that the Dow/Gold Ratio has just topped out in its uptrend & is soon to head down to new lows (perhaps down to 2:1 or 1:1)
The following charts will show why I think that this epic turn has just happened & what should follow.
Perhaps I'm early in calling this turn but the recent sharemarket action points to the turn having happened.
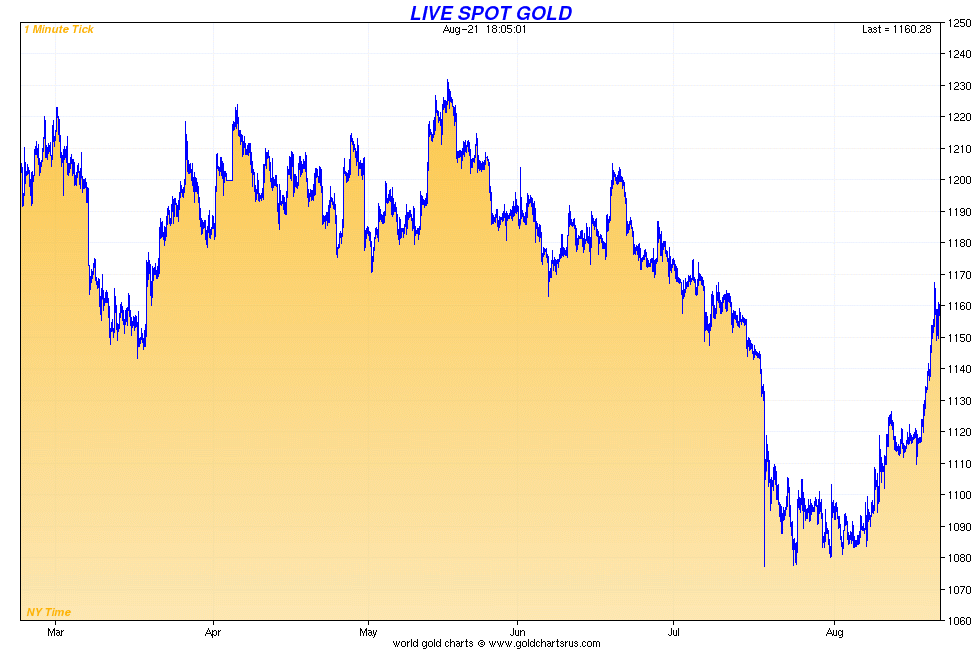
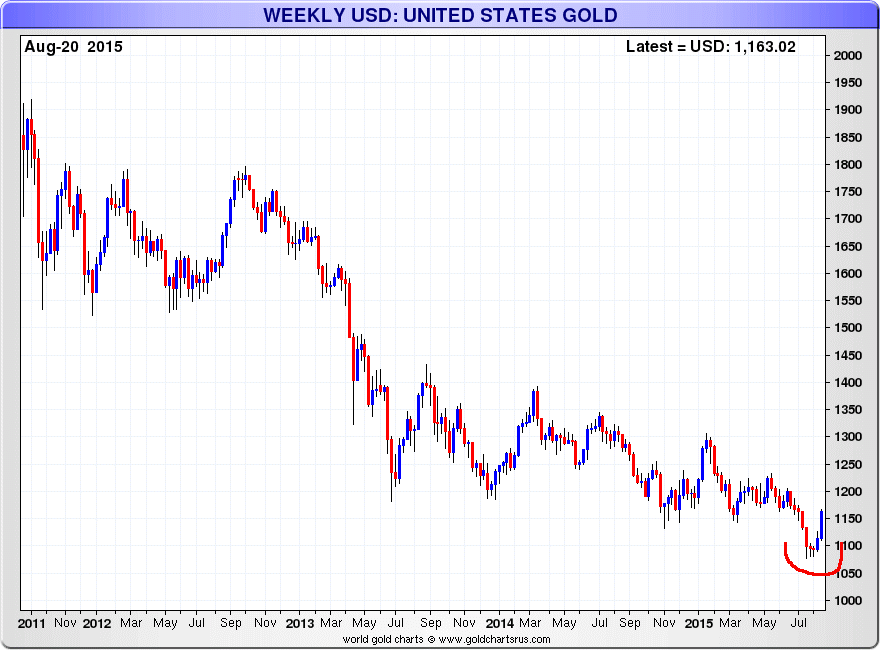
Here's the recent bottom in gold showing that gold has now rising above the breakdown level of 1145.
Here's the bear market for gold with the latest rebound highlighted
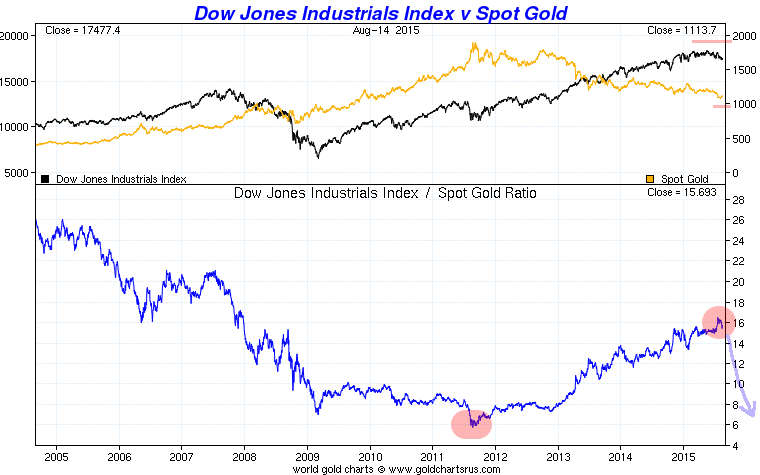
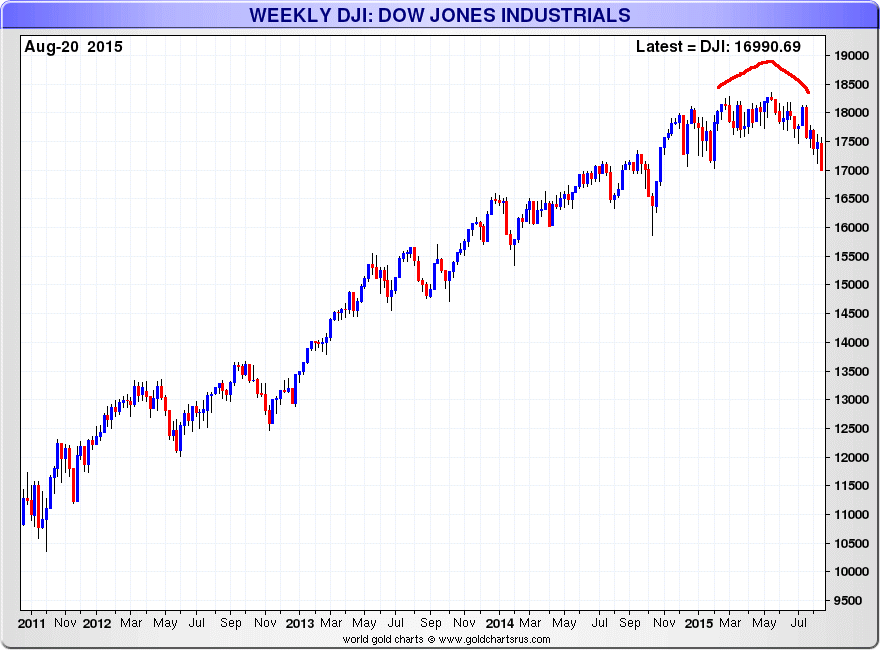
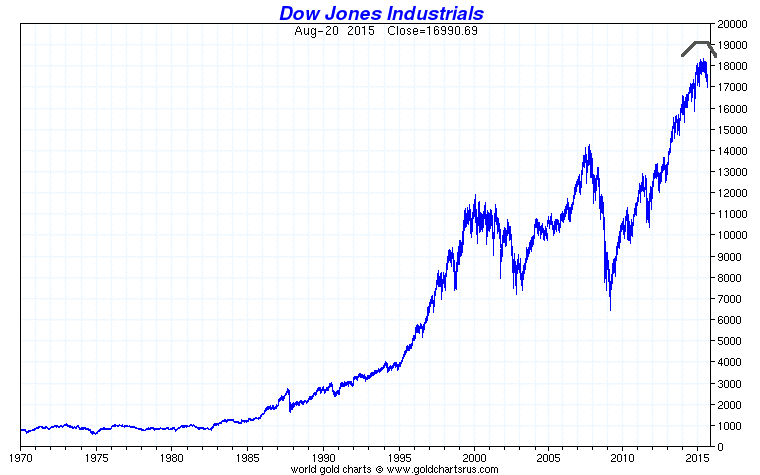
Here's the Dow topping out & turning down - today the Dow hit 1650 with a 530 point decline.
Here's the Dow over the long term & you can clearly see the secular tops - with the latest currently being put in place.
And here's the Dow/Gold Ratio which shows the recent high of 16.5:1 & the prior low of 6:1
With the Dow trending down & gold trending higher expectation are for the prior lows to be taken out as the ratio heads down to 1:1
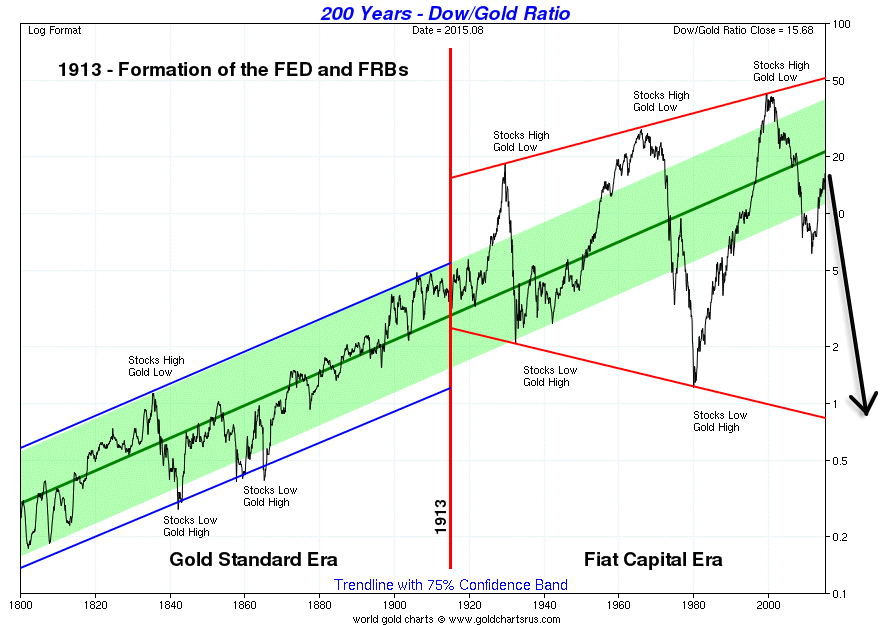
Here's the big picture on the Dow/Gold Ratio showing the expected move.
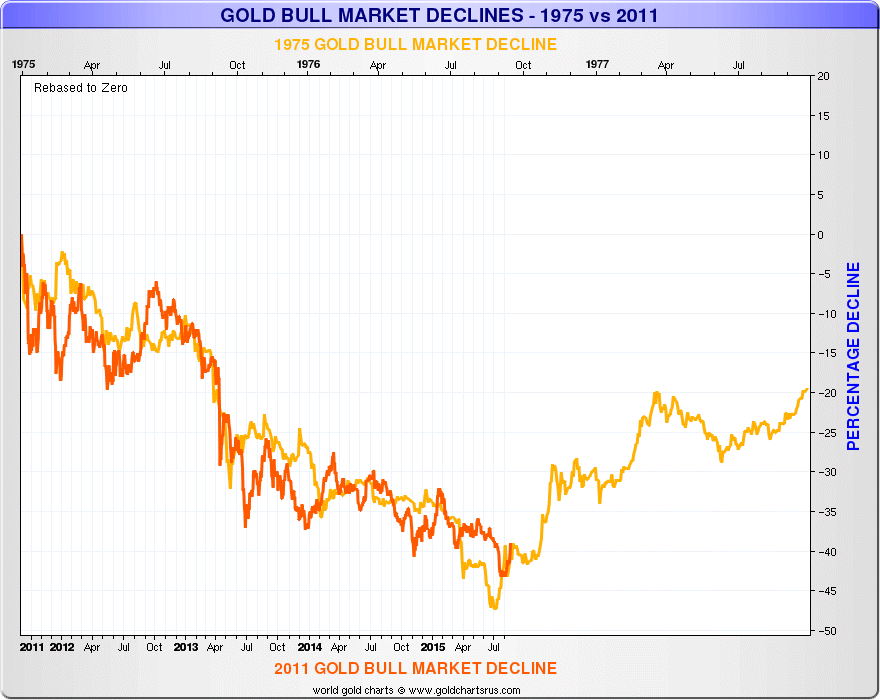
Decline wise here's an overlay of the 1975-1076 47% decline with our almost 4 year 43% decline.
And here's a longer look at the same picture which also shows the expected potential ahead of us.
I believe that the Dow/Gold Ratio metric is one of the most important ones in the gold sphere.
It measures the holding sentiment between fiat & physical assets & swings like a pendulum through time.
Fear is a strong driver for gold & as the financial markets break down & fiat asset values decline the world's wealthy will seek refuge behind gold's safe haven status.
As more people sell their fiat positions & buy gold it propels this metric to new lows.
And gold moves higher under the ever increasing demand....
Reproduction, in whole or in part, is authorized as long as it includes all the text hyperlinks and a link back to the original source.
The information contained in this article is for information purposes only and does not constitute investment advice or a recommendation to buy or sell.
