The astonishing Fed again proved the consistency of its inconsistency.
Since its creation in 1913, and especially after WWII, the Fed has always been behind the curve. It is hard to believe that this is just incompetence. The recent change of policy hardly seems to be part of a plan but rather another reaction to events. Looking back at the Fed’s policy decisions, it is clear that virtually all are reactive rather than proactive.
Central banks have been totally detrimental to the world economy. They serve no constructive purpose whatsoever. As a matter of fact, they are a menace to the world and actually make things a lot worse than they would be if the laws of nature would rule. The natural rhythm of ebb and flow would regulate markets effortlessly without the need for artificial interference by central banks. If demand for credit is too high, the law of supply and demand would restrict the supply by interest rates going up. And if there was no demand for credit, loans would be cheap with rates going down.
Instead, what we have now is manipulated rates at zero or negative and more debt outstanding than ever in history. That breaks all laws of nature and can only happen through false markets. This has led to global debt trebling in this century. No wonder we have massive bubbles in stocks, bonds and property together with debt that will never be repaid.
FED – 65 YEARS OF INCOMPETENCE INCONSISTENCY
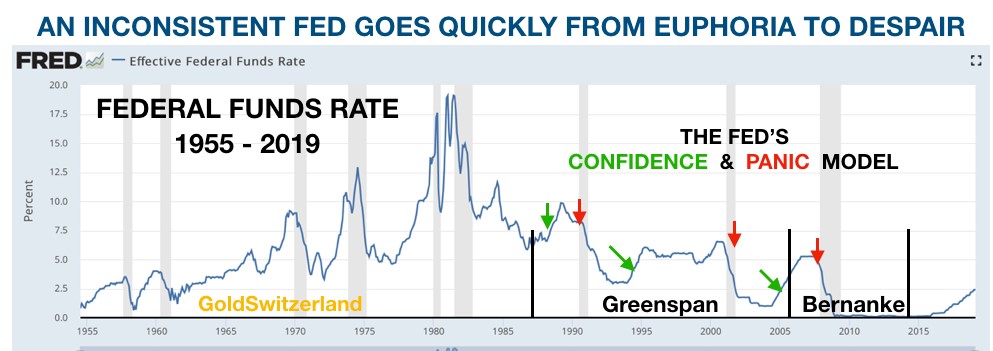
The chart below shows the Fed rate for 65 years. Just looking at recent history, the revered Alan Greenspan raised rates in late 1987, then crashed rates from 10% in 1989 to 3% in 1992. Thereafter, the Fed funds rate gradually increased to 6.5% in July 2000 when the Nasdaq crash started. A crash of 80% in the Nasdaq forced a reactive Fed to reduce rates to 1% in late 2003.

Stocks stabilised and rates were raised to 5% by Sep. 2006. Then came the subprime disaster and the reactive Fed slashed rates to virtually zero by December 2008. Rates stayed at that level until December 2015. Seven years of zero interest rates did wonders for the stock market and also gave the illusion of a growing economy. The chart reveals it all.
The red arrows in the graphs clearly show Fed decisions caused by a panic reaction to unforeseen events, either stock market falls or systemic problems. At none of these points did the Fed forecast the latent disaster. Clearly none of their models work and nor do they see that rather than solving problems, they are the cause of the problem.
MONEY PRINTING CREATES THE FALSE ILLUSION OF GROWTH
Obviously economies will grow in nominal terms if central banks around the world print trillions of dollars, euros, yen, renminbi etc. and at the same time set interest rates at zero or negative. The only problem is that more and more money needs to be printed just to stand still. Because if you could create wealth by printing money, why would anyone need to work?
CENTRAL BANKS WILL LOSE CONTROL OF INTEREST RATES
As the US economy deteriorates, rates are more likely to go down than up. Eventually there will be full blown QE of a magnitude that will dwarf the 2007-9 money printing. But I don’t expect rates to stay low for very long. Firstly, the dollar will fall precipitously. Then international credit markets will panic and start selling US treasuries. China and Japan have more than $1 trillion each of US debt and they will dump it as fast as they can. This will start a vicious cycle of falling bond markets, higher rates and a crashing dollar. Central banks will then lose total control of rates as the long end of the market pulls the shorter rates higher. As the money printing intensifies, inflation will surge putting further upward pressure on rates. At some point in the next few years, rates will at least reach the 1980-81 level of 20%. With hyperinflation and defaults, rates could go even higher.
This is of course nothing new in history. I remember when I lived in the UK in the 1970s how rates and inflation were in the mid to high teens for several years. For a while I paid 21% interest on my first mortgage in the UK. How many people could afford that today? Absolutely nobody of course. Nor could any country service its debts even with rates going up just a couple of percent. With the much higher rates that I am forecasting, debts can only be serviced through unlimited money printing of worthless fiat money. This will further put pressure on the dollar and other currencies and accelerate the decline to their intrinsic value of ZERO.
SECULAR BEAR MARKET IN STOCKS COMING
Not a scenario that many people could believe today but as we know, optimism is at a peak just before markets turn. We could be at that point now. My preferred scenario has always been that markets topped in the autumn of 2018. Most European and Asian markets are well below their peaks. The US market has attempted to make new highs but so far failed. When a market is in a perma-bull mode, all news is good news. Higher rates mean a strong economy, so the market goes up. Lower rates stimulate the economy, so the market goes up. But in spite of continued uber-optimism, the Dow has so far not managed to break the highs. And why should it when earnings forecasts are looking grim and the economy is turning down.
There is still an outside chance that we will see a final hurrah in stock markets. That could take a few months, but the end result would still be the same – a massive secular bear market which will shake the world.
HYPERINFLATION TO BE FOLLOWED BY DEFLATIONARY IMPLOSION
I regularly meet and give talks to family offices and other UHNWIs. Still today, there is virtually no fear among these groups that the trend in markets will reverse. Nobody sees any risk in the bubble asset markets such as stocks and bonds. Many of them are all like Alfred (see my article), born at the end of WWII, successful in their professional life and have made big profits on stocks by permanently being long the market. The fact that trees don’t grow to the sky hasn’t entered their mind. If you can make a fortune from investing over a 50 year adult life, why won’t it continue? Very few can fathom that they have been living in an era fuelled by credit expansion and money printing which have artificially propelled asset markets ever higher.
But if it has lasted 50 years, why can’t it continue another 10 years or more? In theory this is of course possible but we are no longer just talking about one market or just the West. No, this rubber band has been over-stretched all around the world from Australia in the South to Norway in the North and from China in the East to California in the West. The snap back will come out of the blue and take the world by total surprise. After a short hyperinflationary money printing period, global assets and debts will implode and we will see a fall in global wealth of at least $200 trillion in today’s money. And much more in hyperinflationary money.
MASSIVE WEALTH DESTRUCTION
In coming years, the world will experience the biggest wealth destruction in history and it will come as a total shock to 99.5% of investors. For the 0.5% who are prepared for this, it will be the opportunity of the century. It will be “The Biggest Short & The Spectacular Long”.
The short is obviously asset markets such as stocks, property and bonds. And the long is precious metals like gold and silver. But this trade won’t work like in the 2006-9 crisis. This time financial markets are unlikely to perform and counterparties will fail. Therefore, buying financial futures contracts or derivatives will serve no purpose since no one will be in a position to cash in.
So this short and long will have to be played differently. The short side this time means getting out of all the bubble assets and have a minimal exposure to stocks, bonds etc. And the long side doesn’t mean buying ETFs or futures. Instead, investors must own physical assets like gold and silver and store them outside the financial system.
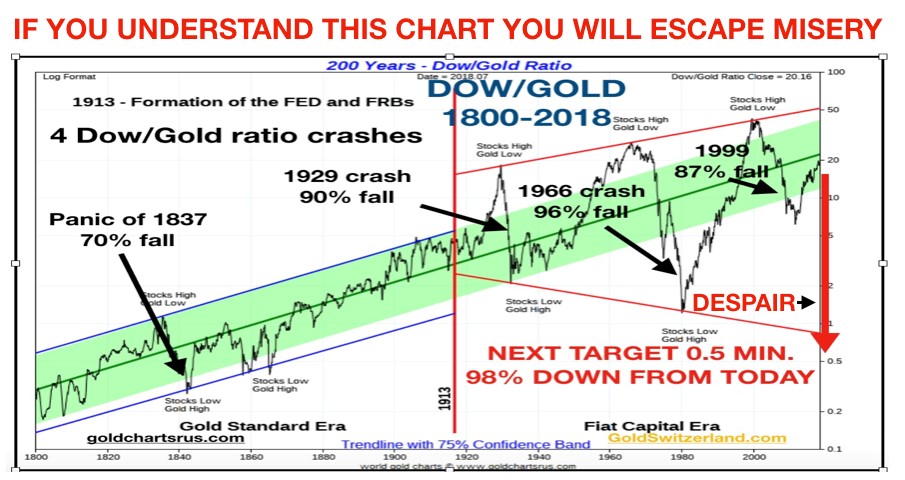
The graph below shows what it will look like. It is the 200 year Dow/Gold ratio (the price of the Dow divided by the gold price). This ratio crashed to 1 to 1 in 1980. This means that the prices of the Dow and Gold were the same at 850. As stocks rose and gold came down, the ratio peaked at 45 in 1999. It then fell by 87% to 5 in 2011 as stocks crashed and gold surged. Since then we have seen a correction up in the ratio but the Dow is still down 57% against gold in this century.

And soon the ratio is ready for the resumption of the downtrend which is likely to overshoot the 1999 level at 1 and reach 0.5 or even much lower. This means that the Dow will fall at least 98% from today against gold.
HOLD ON TO STOCKS AND LOSE 90% OR PRESERVE YOUR WEALTH IN GOLD
So the choice is simple. Hold on to stocks and see them decline by at least 90% like 1929-32. Alternatively, investors who sell their stocks and buy gold will instead of losing most of their wealth benefit from gold going up to levels which are unimaginable today. That could be $10,000 or $50,000 even in today’s money. Add many noughts when we get hyperinflation.
Similar moves could be expected in both bonds and property against gold. As credit markets crash and rates surge, there will be major defaults including sovereign defaults. Most major nations won’t officially default, they will instead introduce 10-100 year moratoria which in effect is another way of defaulting. In addition, the dollar and other currencies will be debased to virtually zero, making most bonds worthless. Same with property markets. Bricks and mortar have no value if the property doesn’t return a yield in the form of rent. A very high percentage of tenants will be unable to pay rent or service their debts, leading to major defaults in real estate lending and a crash in property prices.
So investors who get out of stocks today and buy gold will not only save themselves from ruin but also make a considerable fortune in gold. But sadly, less than 1% of investors will be prepared for this and therefore will experience a total destruction of their wealth built up over a lifetime.
Original source: Matterhorn - GoldSwitzerland
Reproduction, in whole or in part, is authorized as long as it includes all the text hyperlinks and a link back to the original source.
The information contained in this article is for information purposes only and does not constitute investment advice or a recommendation to buy or sell.


