Gold log chart. Could it possibly look any more bullish ? I don't think so.
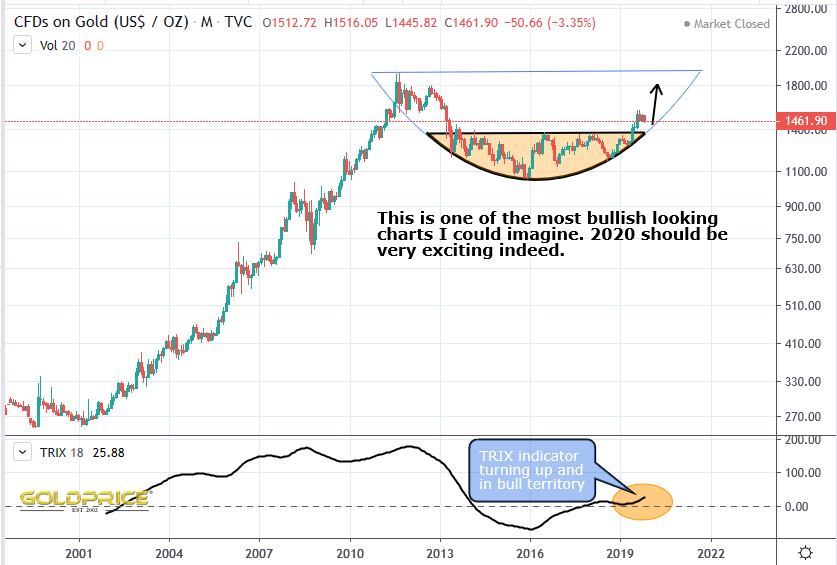
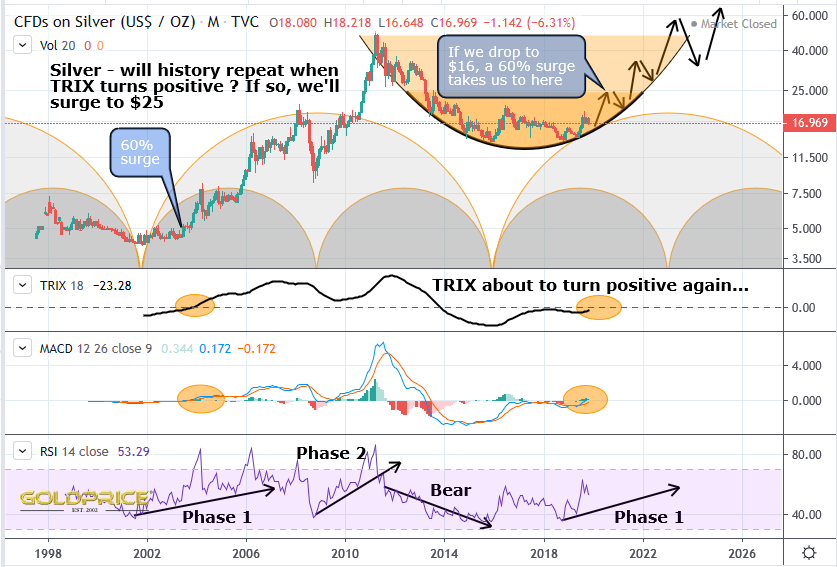
I don't usually like to forecast precise numbers, but, just for fun... $1700 Gold, $25 Silver and a Gold/Silver ratio of 68 within the next 6 months.
Original source: Northstar - Twitter
Reproduction, in whole or in part, is authorized as long as it includes all the text hyperlinks and a link back to the original source.
The information contained in this article is for information purposes only and does not constitute investment advice or a recommendation to buy or sell.


