A generally reassuring July report on US inflation, despite some pockets of resistance: The consumer price index (CPI) rose 0.2% month-on-month and 0.3% for core CPI (excluding food and energy), which appears to confirm a steady slowdown towards the Fed's 2% target. But the composition of these figures hides more contrasting realities.
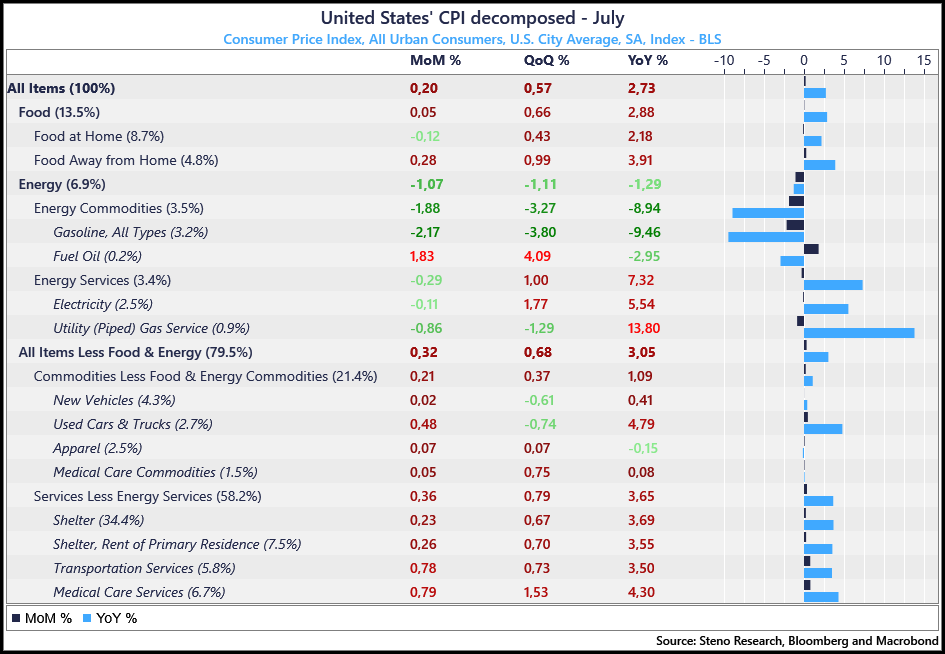
Housing is the most striking example. The CPI shows an annual increase of 3.7% for shelter, while real-time data (Apartment List, Zillow) show stable or even slightly declining rents. The discrepancy stems from the calculation method: the “owners' equivalent rent” reflects the surge in rents in 2023 with a lag of six to twelve months and completely ignores the rise in mortgage costs. For new buyers, the real burden has risen much more than the CPI suggests; for new tenants, the market is already more flexible than the official figures indicate. This discrepancy should automatically pull overall inflation down in the coming months, as the slowdown in rents feeds into the index.
Other categories remain more stubborn: medical services jumped 0.8% in July, car insurance remained more than 5% above its level a year ago, and airfares rebounded 4% after a decline in June. Energy was the main drag, falling 1.1% on the month (gasoline -2.2%), but this support is fragile; a reversal in the oil market could quickly reverse the effect. Food prices remained stable overall, with a contrast between food at home, which fell slightly, and food services, which rose by 0.3% over the month (+4% year-on-year), evidence that services inflation remains sticky.
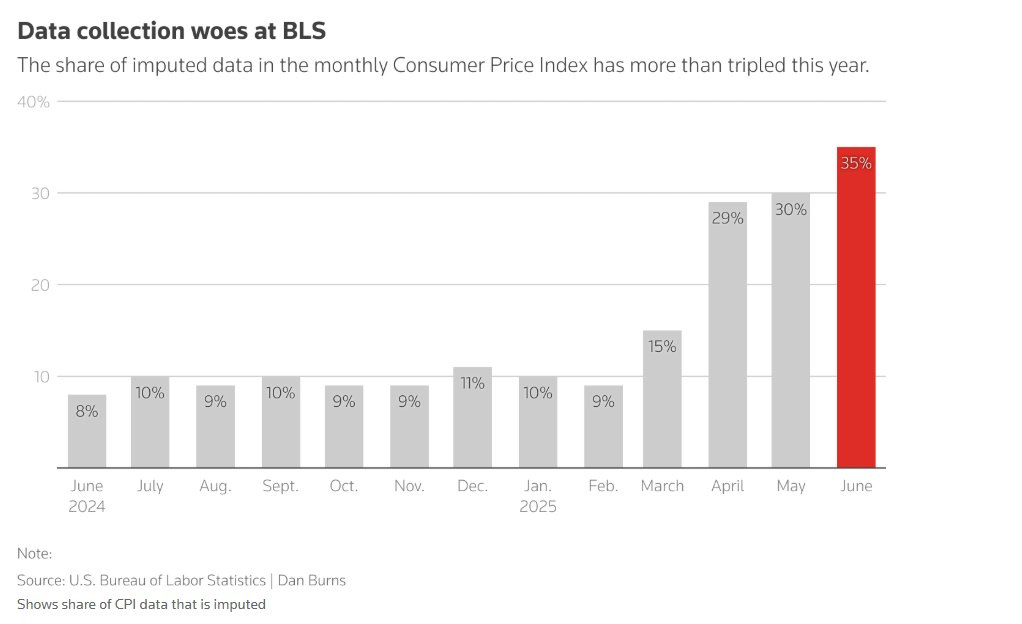
Beyond these sectoral movements, interpreting the CPI is complicated by its own methodological changes: shifts in data sources, the imminent withdrawal of long-term care insurance, annual updates to weightings that accentuate the index's sensitivity, and “quality” adjustments that sometimes underestimate households' perceptions.
The share of imputed data in the monthly CPI calculation has tripled. This is problematic because imputed data are, by definition, estimated rather than directly observed values, and their reliability is based on assumptions that may not remain valid in a changing market environment.
The July figures do not represent the “inflation shock” feared by some and allow for a more accommodating response from the markets. However, the road to 2% remains fraught with obstacles: non-housing services are still growing, and a rise in energy prices or continued wage inflation could delay any monetary easing.
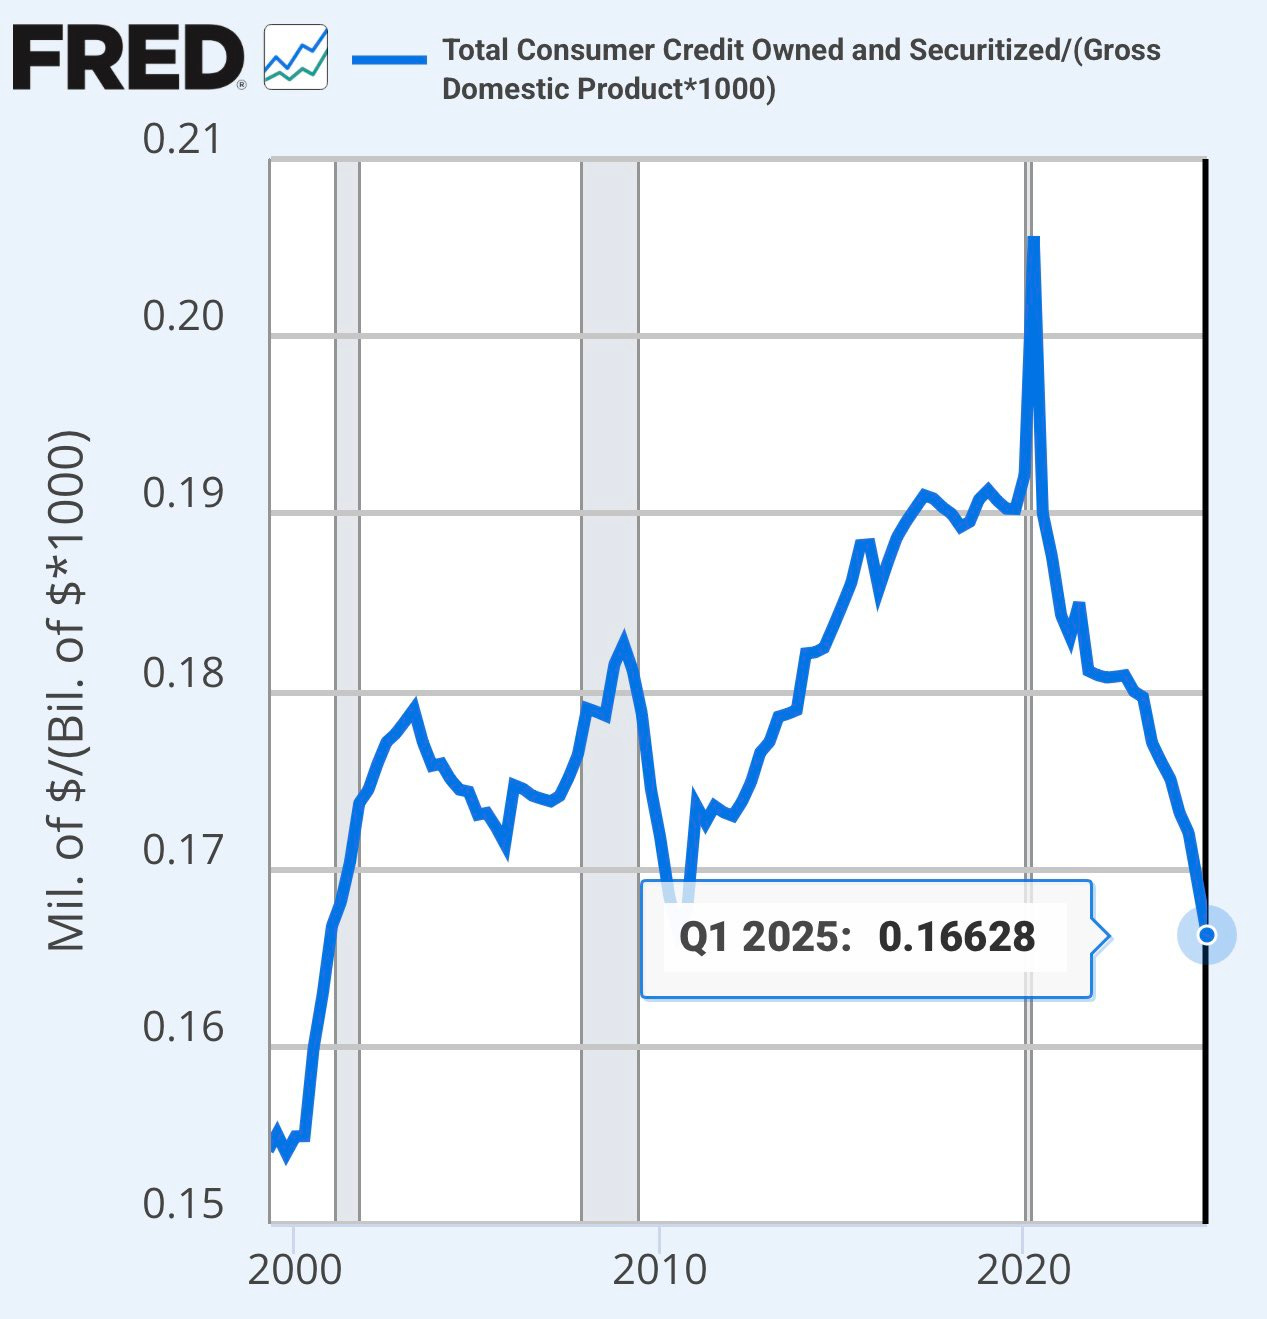
Real wages rose by +1.2% year-on-year in July, a solid pace that is consolidating the momentum of the US economy. This increase, supported by moderate inflation, has enabled households to significantly reduce their debt. This deleveraging is all the more powerful given that households have significant unrealized gains on the value of their homes, which were purchased with 30-year fixed-rate mortgages at around 3%. The easing of the debt burden, combined with increased purchasing power, is now a major support for consumption and activity.
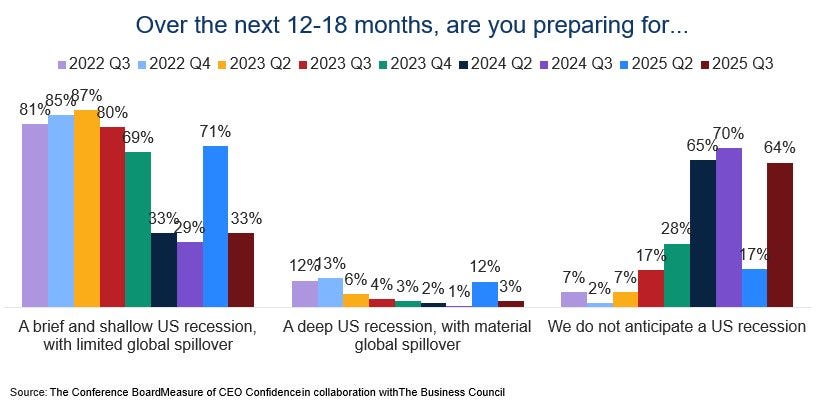
This turnaround has caused a dramatic shift in sentiment among US business leaders in recent weeks. In the space of a single quarter, perceptions have completely reversed: while 71% of these executives anticipated an imminent recession in the previous quarter, more than 64% now believe that the economy will avoid it.
This shift in mood contrasts sharply with the signs of a slowdown in the employment figures published last week, which pointed to the onset of a recession. It also highlights the failure of forecasters to accurately predict the timing of this economic cycle, illustrating once again the difficulty of synchronizing leading indicators with the reality on the ground.
Economists are now debating the short-term effects of Trump's new tariffs. Powell's warning about the “tariff tax” clashes with CPI calculations: according to Goldman Sachs, 49% of the cost of tariffs is borne directly by consumers. However, with inflation at 2.8% in July, the index still masks an estimated annual cost of $1,000 per household linked to the trade war. The evidence can be found in electricity bills (+5.5%) and shopping carts.
With an average rate of 18.3% — a record since 1935 — the Fed estimates that two-thirds of distributors raised their prices before the holidays. Several economists, including Nobel laureates, are warning of a risk of a +0.7% increase in the CPI in the coming months. Meanwhile, the administration is firing BLS officials and putting pressure on Fed governors. For them, this is not a moderation of inflation, but a structural deterioration masked by opportunistic statistical treatment.
Trump, for his part, accuses Goldman Sachs of getting its forecasts wrong. On this point, he has a point: July inflation remained subdued. But Goldman maintains that the effects will materialize later.
Let's take a step back from the current hubbub and look further ahead.
Pricing policy becomes particularly important when looking several years ahead. In the short term, its effects may seem diffuse or delayed, depending on how quickly they are passed on to consumer prices. But over time, the costs add up: persistent customs duties, reorganized supply chains at higher cost in an increasingly complex geopolitical context, less competition in certain segments, and chain reactions in price setting. Even if the initial impact appears moderate in monthly indices, inflationary pressure is gradually building, permanently changing the cost structure for both businesses and households.
In the longer term, US fiscal dynamics — with debt growing faster than GDP — are pushing for higher yields. As these levels would be unsustainable for the government, the temptation to resort to monetary financing will remain strong, inevitably fueling CPI over the years.
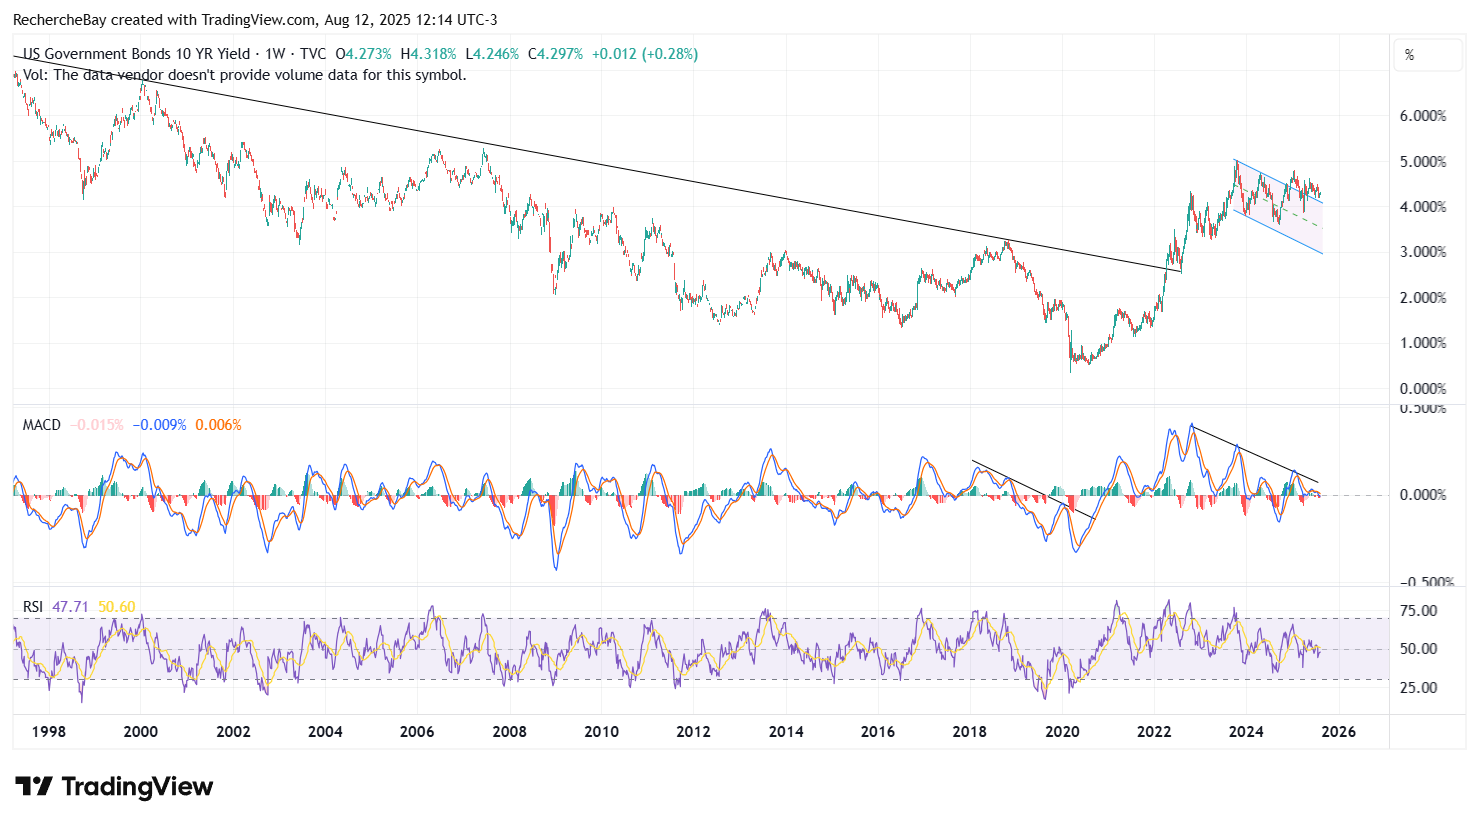
This is highlighted by the long-term chart for the US 10-year bond. After the paradigm shift in February 2022, marked by the break in the long-term downtrend, the yield formed a bullish flag pattern, which was broken to the upside in 2025. Since then, this breakout has been tested several times, without the yield returning to the pattern. In other words, the bullish breakout has never been invalidated, despite persistent market expectations of several rate cuts this year.
It is this long-term outlook — one of sustained inflation and long-term interest rates anchored on an upward trajectory — that is one of the pillars supporting gold prices over the long term. This is particularly true given that, at this stage, no one is really significantly exposed to it. Admittedly, CTAs (Commodity Trading Advisors) have increased their allocations to gold and are maintaining net long positions. These funds, which are often managed systematically and quantitatively, follow trend or momentum models on the futures markets. Their approach consists of mechanically adjusting their positions in line with price and volatility signals, which can amplify movements when a trend is well established.
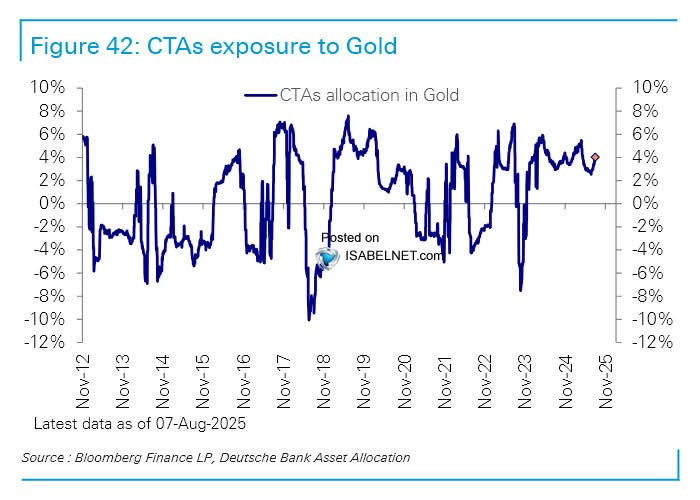
Currently, their positioning reflects a bullish sentiment fueled by both structural factors — such as the search for safe havens amid prospects of rising public debt and more inflationary monetary policies — and tactical factors, such as the favorable technical configuration of the gold market in 2025. However, in absolute terms, these positions remain modest compared to the potential for a real influx of institutional or retail investment, suggesting considerable room for growth if the long-term scenario plays out.
In terms of allocations in gold-backed ETFs, the picture is similar: the recent performance of the yellow metal has led to only very cautious positioning. In the US, there are signs of movement, with some funds beginning to reallocate a small portion of their portfolios to gold, often as part of a cautious diversification strategy in the face of monetary and fiscal uncertainty. In Europe, however, it is flat calm: flows into gold ETFs remain virtually zero, a sign that investors on the Old Continent have not yet been won over by the movement, despite a macroeconomic environment that, on paper, nevertheless favors the precious metal.
Reproduction, in whole or in part, is authorized as long as it includes all the text hyperlinks and a link back to the original source.
The information contained in this article is for information purposes only and does not constitute investment advice or a recommendation to buy or sell.


