It is fascinating how the gold-to-S&P 500 ratio continues to track its historical performance once again after major distortions across the US Treasury curve.
Our empirical analysis suggests that today's outperformance of precious metals relative to the overall equity market is still in its initial phase.
To be precise:
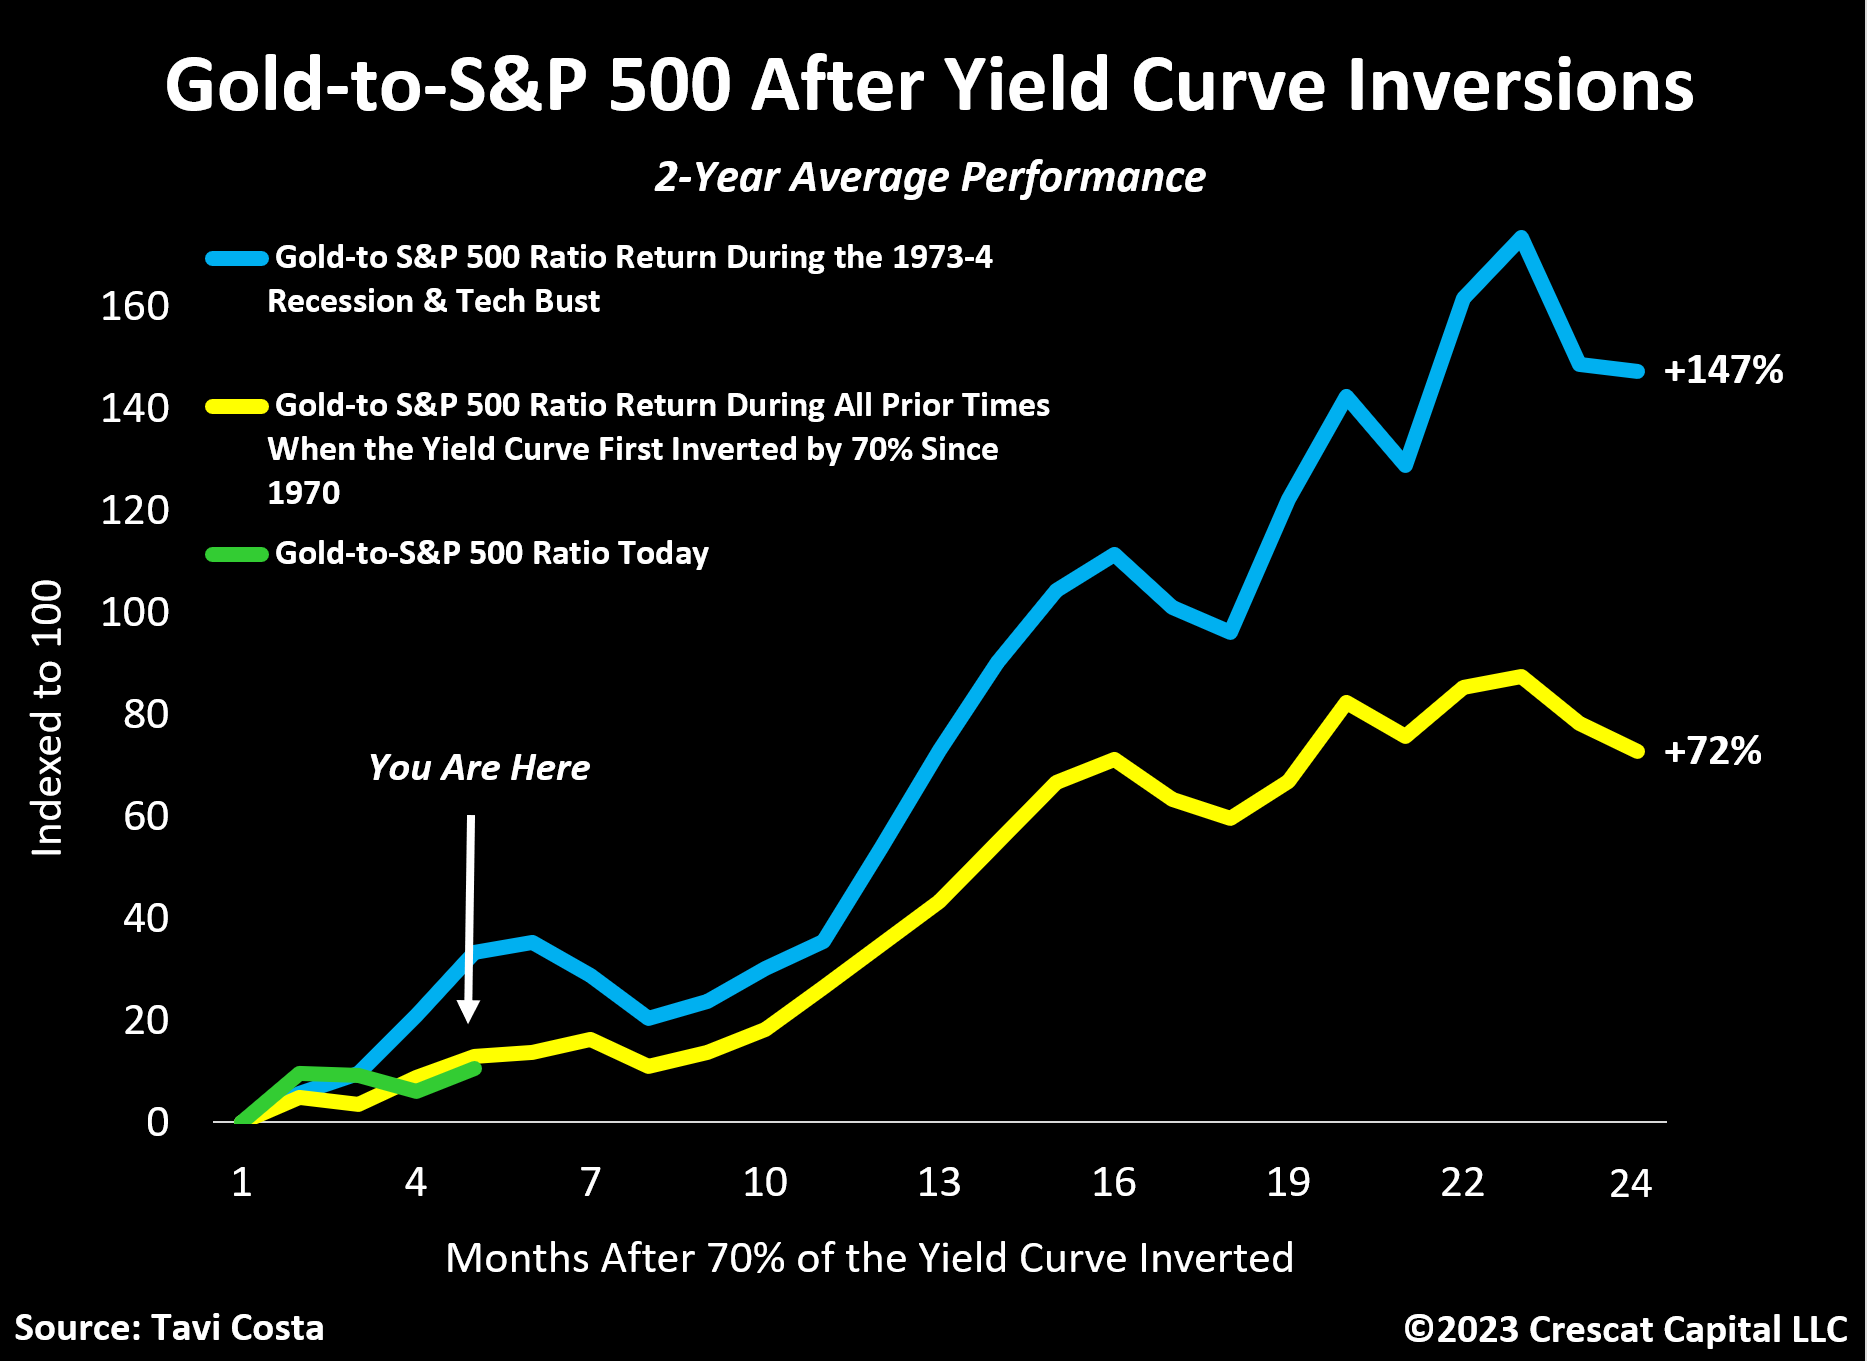
Going back to 1970, this ratio tends to appreciate on average by 72% for the next two years after the US Treasury curve inverts by more than 70%.
This indicator officially flashed a warning signal in November 2022.
As shown in the yellow line, note the strong acceleration in return initiating at the 8th-month mark, which would imply the end of July in today's scenario.
Given how historically expensive financial assets are, particularly versus commodities and gold, it is highly probable that both legs of this trade could work, i.e. precious metals rise as equity markets fall.
To recall, this was also the case during the 1973-4 stagflationary crisis and the tech bust, which in my strong view resembles the current environment.
As shown in the blue line, the performance of the gold-to-S&P 500 ratio during these two specific cases was almost twice as strong as it was when including all the other periods.
Original source: @TaviCosta
Reproduction, in whole or in part, is authorized as long as it includes all the text hyperlinks and a link back to the original source.
The information contained in this article is for information purposes only and does not constitute investment advice or a recommendation to buy or sell.


