This week, we will revisit a blast from the past when we looked at three fun ratio charts back in June, 2023 to see if we could pick up any clues about the future direction of the gold price. I have updated those charts, as they have progressed as expected but not sit at important inflection points.
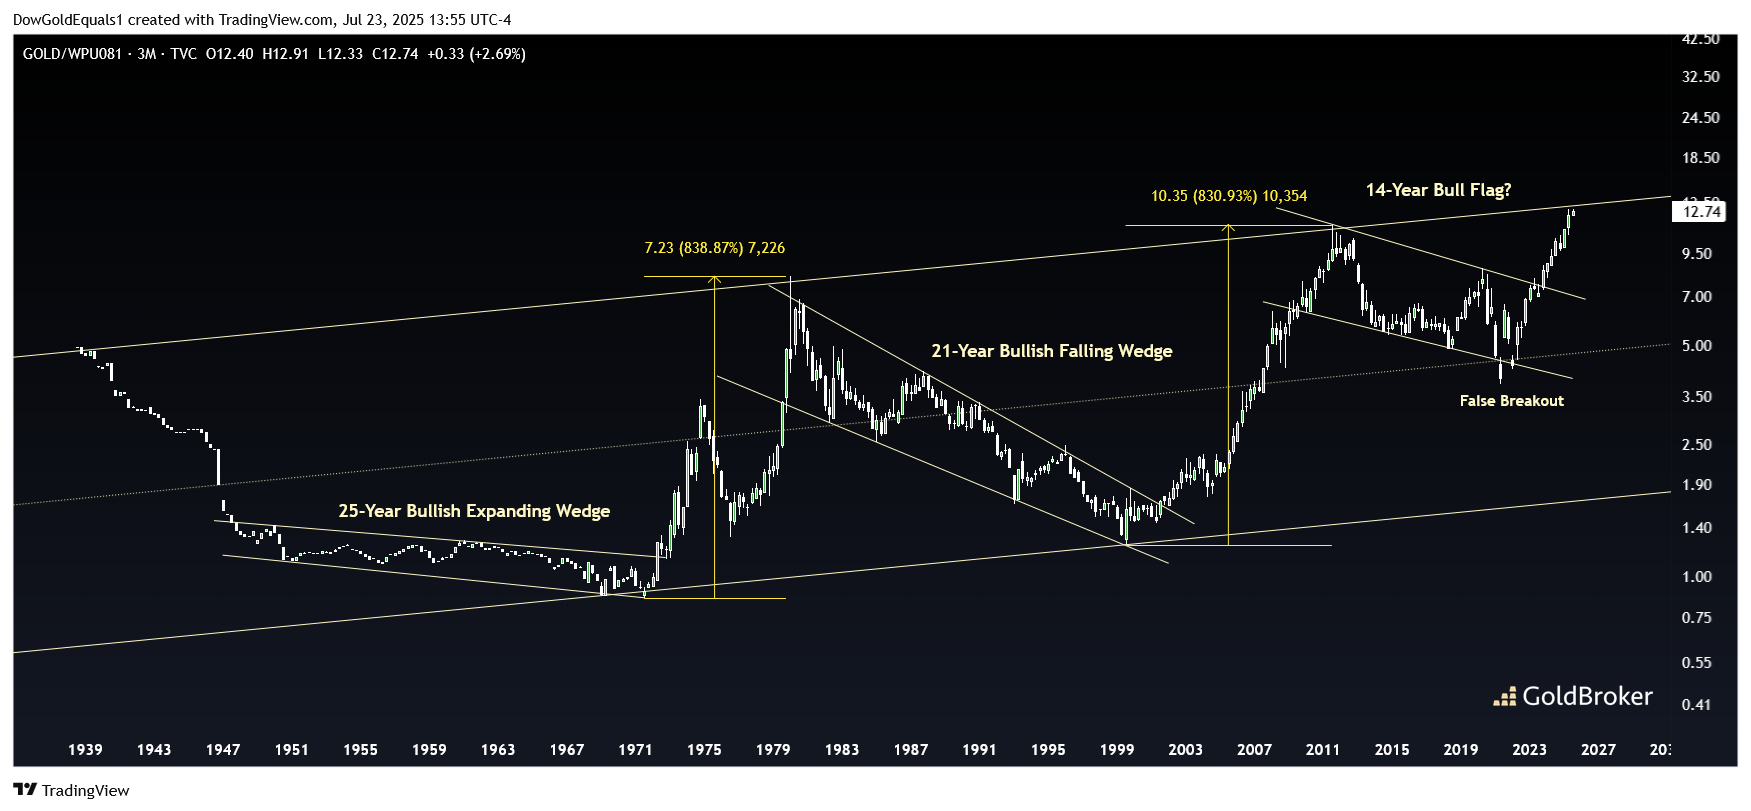
The first chart I have updated is that of Gold vs. the Bureau of Labor Statistics' Producer Price Index of Lumber and Wood Products. Two years ago, we speculated that the current 14-year bull flag might breakout, and we can see that indeed it did. Those of you who swapped investments in lumber for Gold at that time would have likely been rewarded as the ratio increased from 7.5 to nearly 13.0! Now, we can also see how defining the chart as a large ascending channel may prove useful going forward as price currently sits at the top of the channel. Should price fall away from the upper rail, it could mean that it is now lumber's time to take over and outperform. However, a breakout above the channel would be truly historic and meaningful, as Gold would likely be well on its way to an explosive move higher.
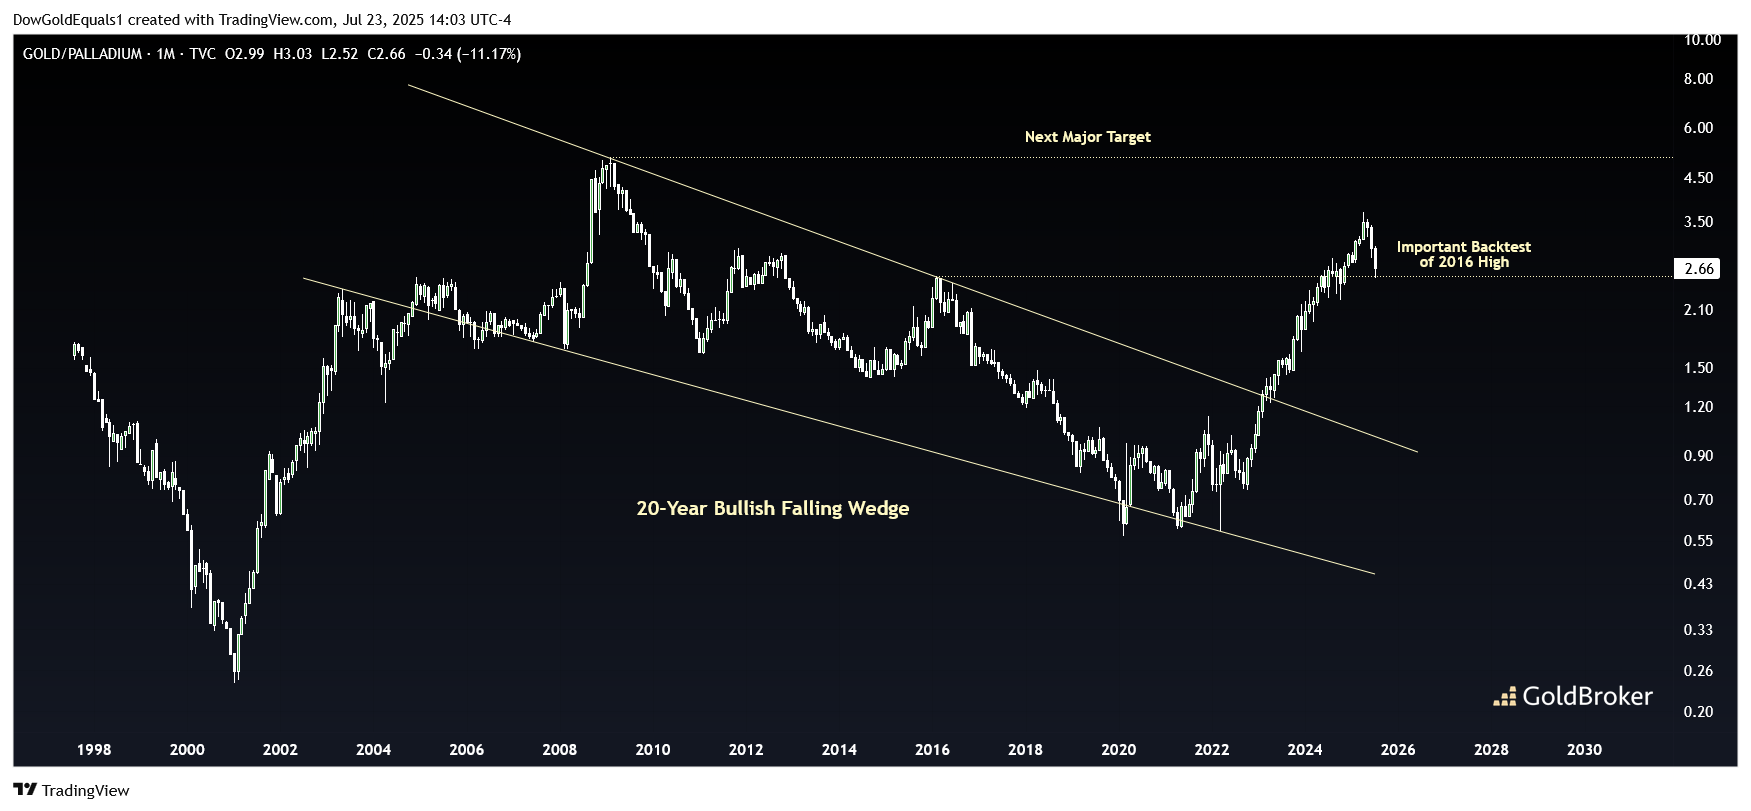
The second chart we will revisit is the ratio of Gold/Palladium. Two years ago, we spotted that the ratio had just broken out of a 20-year bullish falling wedge, signaling that Gold was about to make an impulsive move higher against Palladium. Indeed that is what happened, as the ratio went from about 1.5 to about 3.5! Currently, the ratio has fallen back closer to the 2.5 level as it backtests an important high set back in 2016. If the backtest fails, it is extremely likely that it is time to sell your Gold for Palladium; but if the backtest holds, it could be the launching pad needed to make an assault on the all-time high set in 2009 that would see Gold double against Palladium going forward.
Finally, we'll update the chart of Gold/Microsoft, which was completing a 20-year double bottom at last check. Two years later, we see that the ratio hasn't moved a whole lot as it has formed a much smaller two-year double bottom from 2022-2024. This is not unusual, as I've seen multi-decade double-bottoms form smaller double bottoms on either of the longer-term bottoms. The good news is that if you have not yet traded your tech investments for Gold, you remain very early in the game. Over the course of the Gold secular bull market, I expect this ratio to return to the 2011 high at a minimum, which means Gold would outperform Microsoft by more than 10X from here!

Keep these three charts in mind going forward, and remember that sometimes the best clues are found where few others are looking!
Reproduction, in whole or in part, is authorized as long as it includes all the text hyperlinks and a link back to the original source.
The information contained in this article is for information purposes only and does not constitute investment advice or a recommendation to buy or sell.


