Many of my readers will know that I am a big fan of comparative analysis and that I often look for clues in one chart to help figure out what might happen to another. This week, we'll be doing just that with charts of Platinum and the Gold/Platinum ratio in an effort to see if Gold has a big move left in it.
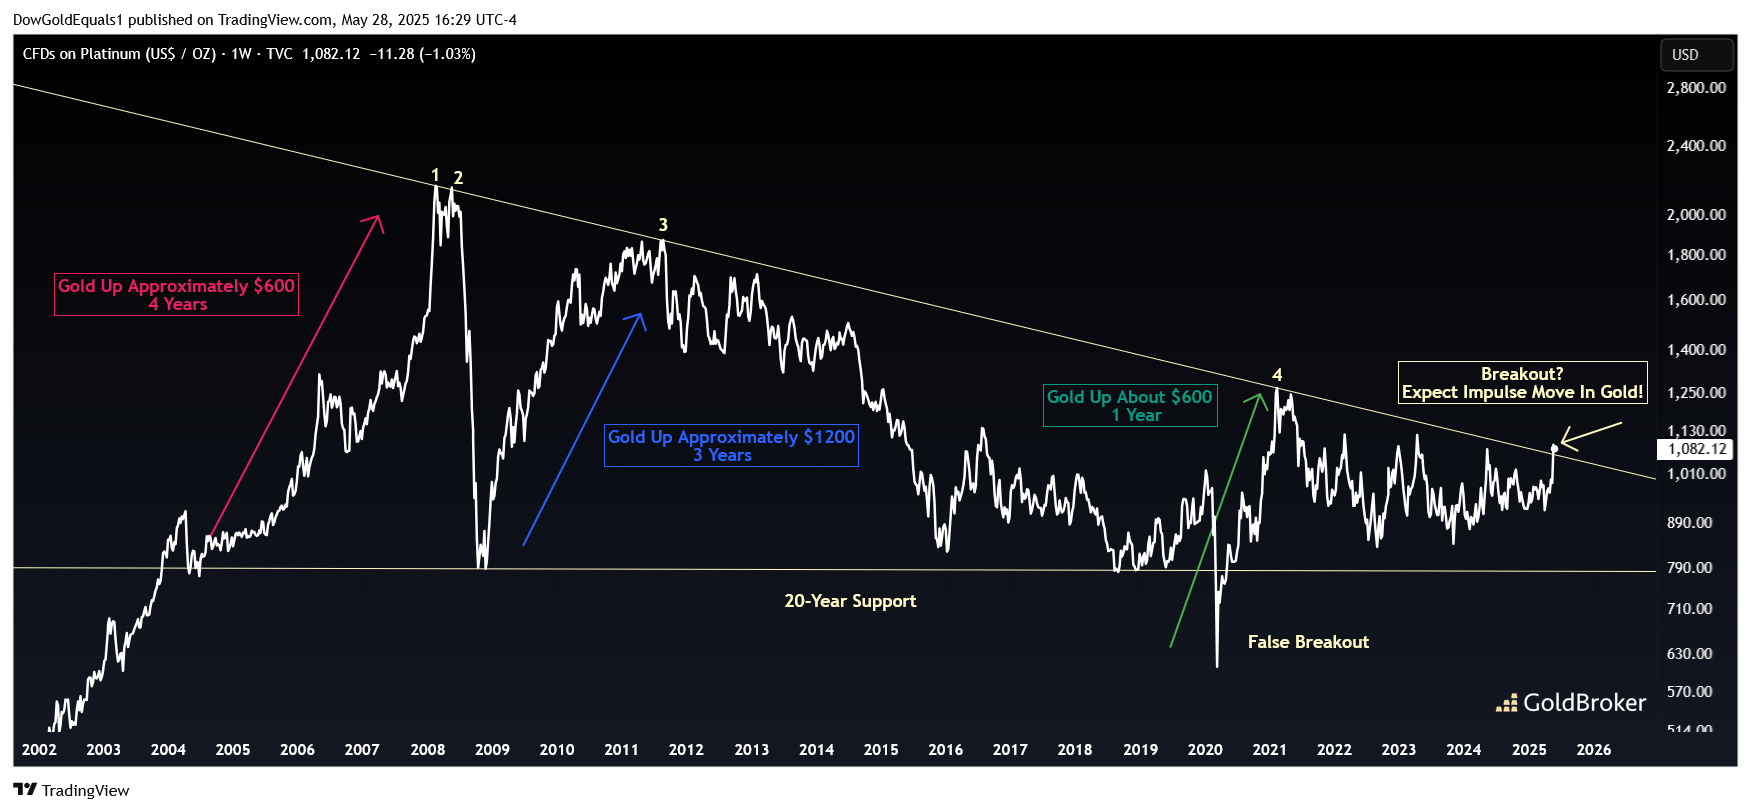
The first chart we'll look at is of Platinum, which I have defined as a giant triangle pattern that spans two decades. I love showing these kinds of charts in my ongoing quest to convince readers that technical analysis can be applied to very long timeframes. I want you to note the three instances when Platinum moved from its horizontal support to the upper rail and the corresponding impulse move in Gold noted. These moves are important within the context of where we are now — a potential breakout of the triangle. A breakout of such a large pattern portends a breakout of enormous magnitude, as twenty years of pent up energy is released. Given the historical connection to gold, this suggests a major move higher in gold could be ahead of us.
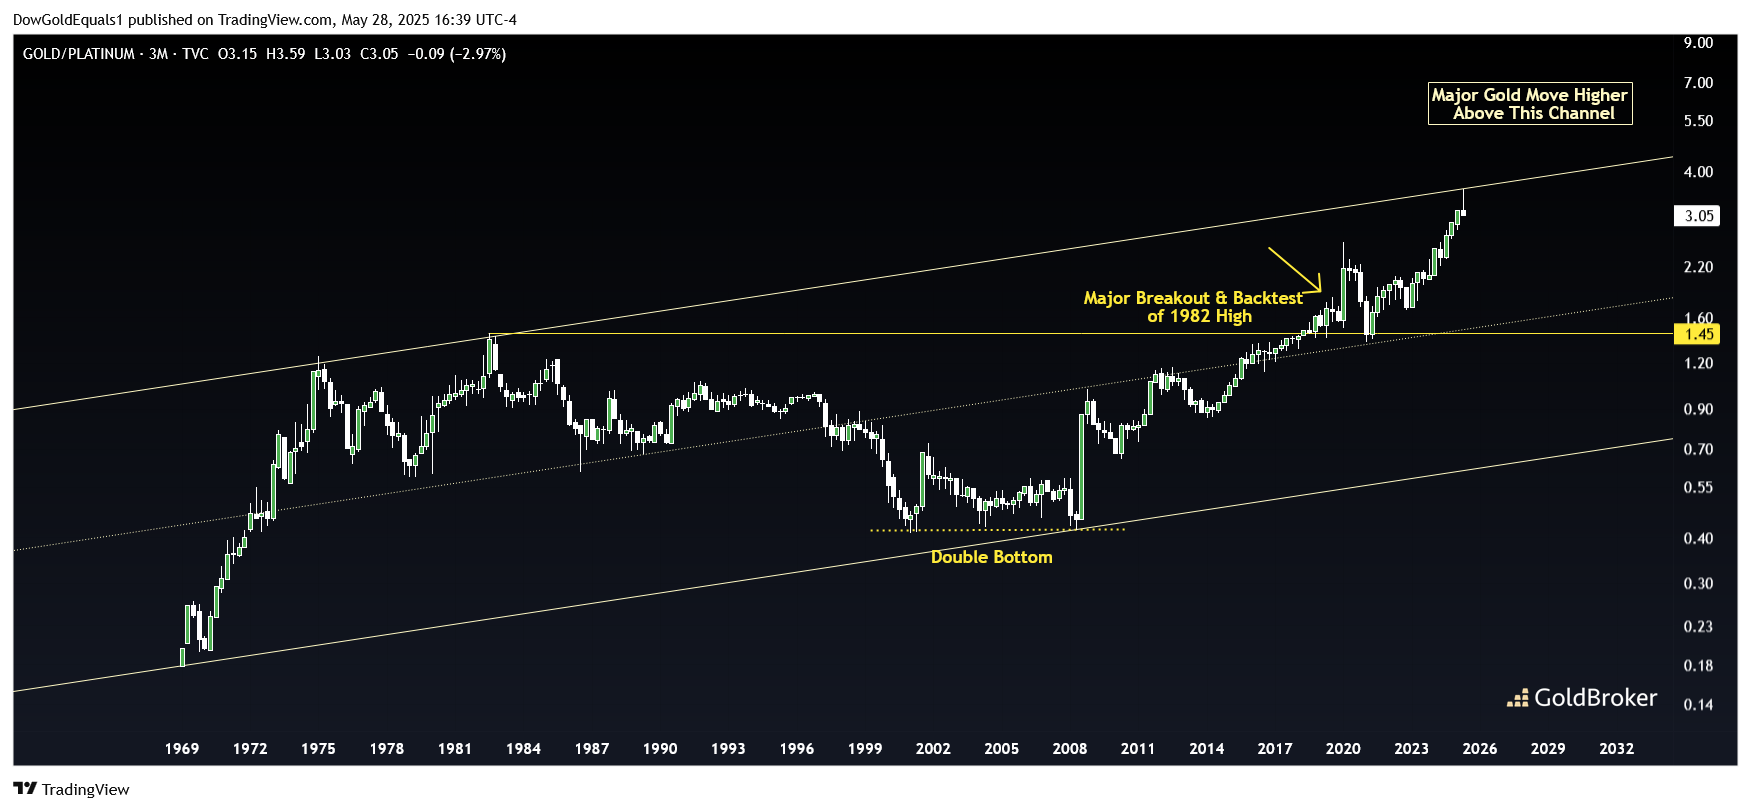
The second chart we'll look at is a ratio of Gold/Platinum, where Gold outperforms Platinum as the chart rises, and Platinum outperforms at the chart falls. If Platinum is indeed on the verge of a major breakout, we want to know which metal will outperform during that impulse move. Here, I've defined the chart as a parallel channel going back to when Gold started trading freely. Interesting features are the double bottom noted that marked the beginning of our current secular bull market in gold; as well as the major breakout and backtest of the 1982 ratio high. Since 2008, Gold has largely outperformed Platinum, but now we see that Gold/Platinum has just run into the upper rail of its ascending channel. If the ratio can break above the channel, Gold prices would likely see an explosive move higher — perhaps a blowoff move that takes it to its ultimate secular bull high. A substantial move lower would signal Gold's move to be more muted, though that move could still be higher if the Platinum triangle breakout in the first chart is the real deal.
Platinum tells us that we could be at an inflection point in the gold secular bull market. Keep Gold in your portfolio, but keep your eyes on the Platinum chart!
Reproduction, in whole or in part, is authorized as long as it includes all the text hyperlinks and a link back to the original source.
The information contained in this article is for information purposes only and does not constitute investment advice or a recommendation to buy or sell.


