This week we'll review a few ratio charts that compare the gold price to various measures of housing in the United States. Despite the housing devastation that took place during the Global Financial Crisis, the old axiom that you can never go wrong buying a house continues to persist. Compared to gold however, we'll see that US housing has been a terrible investment over the past quarter century and will likely continue to be so for years to come.
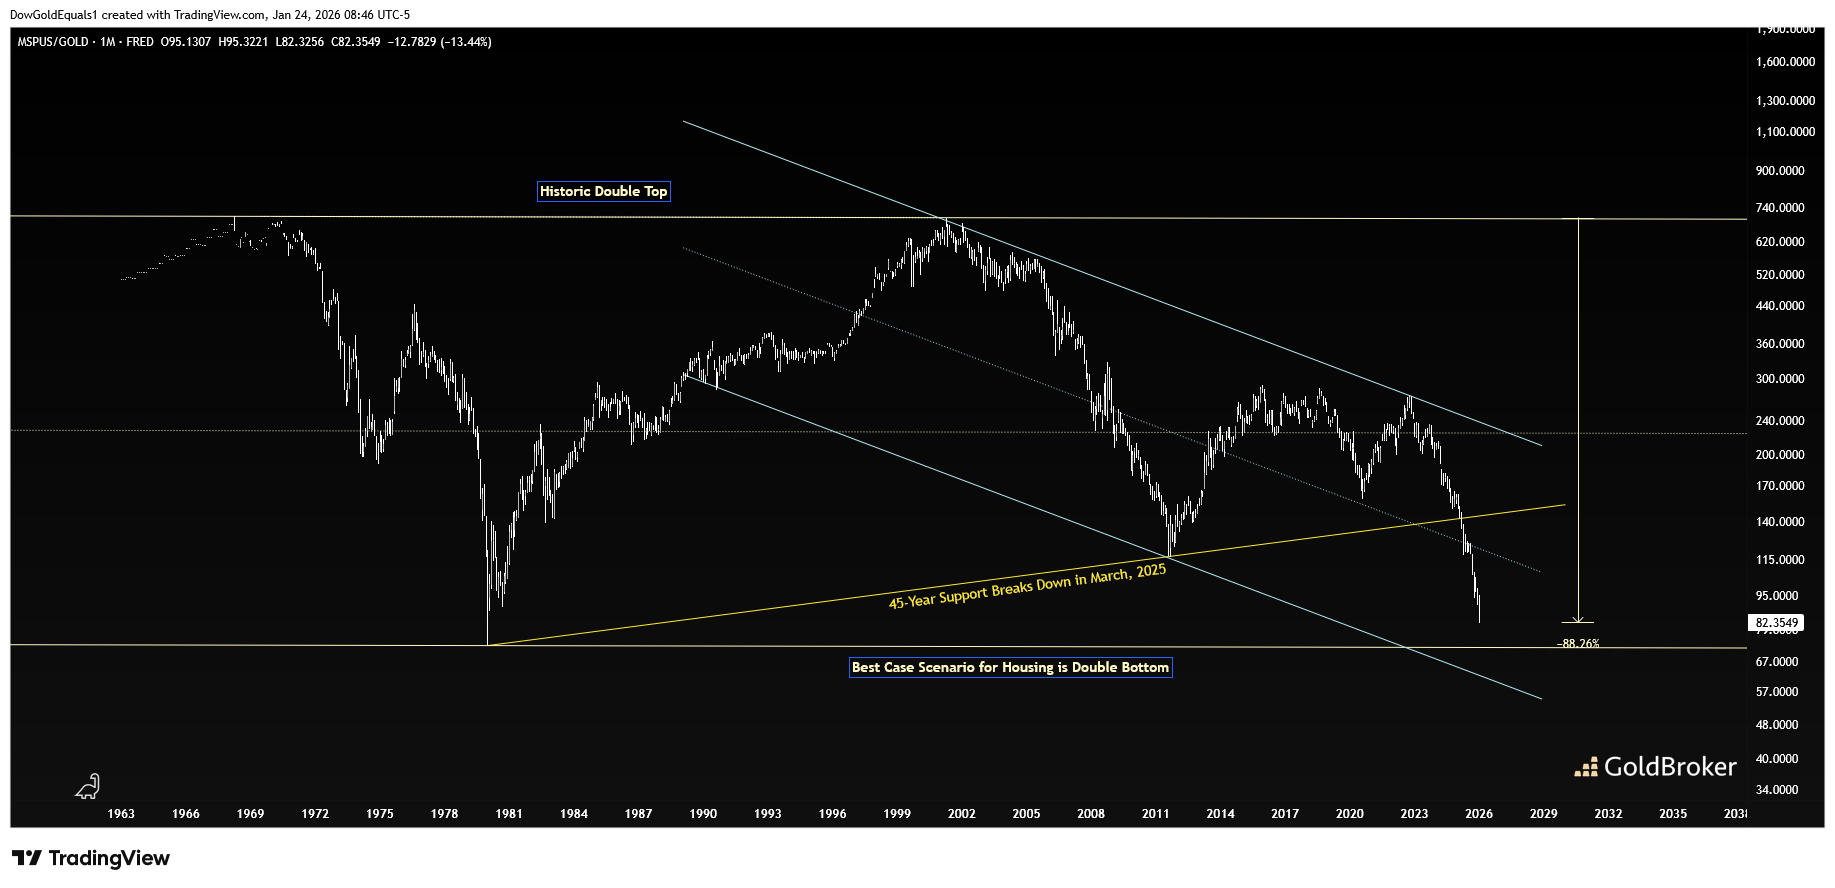
The first chart is the ratio of the median home price in the United States to gold, which I have defined as a yellow horizontal channel going back to the 1960s. The double top (1968, 2001) is notable, as is the near 90% drop in the ratio over the last 25 years! Just last year, the ratio broke down from 45-year support, which led to a waterfall decline that has been evidenced by gold's recent surge higher. As we now approach the lower rail of the yellow channel, I see a potential double bottom as being the best case scenario for housing to avoid further collapse. However, the blue bear channel may have something to say about this, as the ratio may ultimately seek to find its lower rail. Should that happen, the yellow channel would ultimately break down, and from there real estate values could simply fall apart.
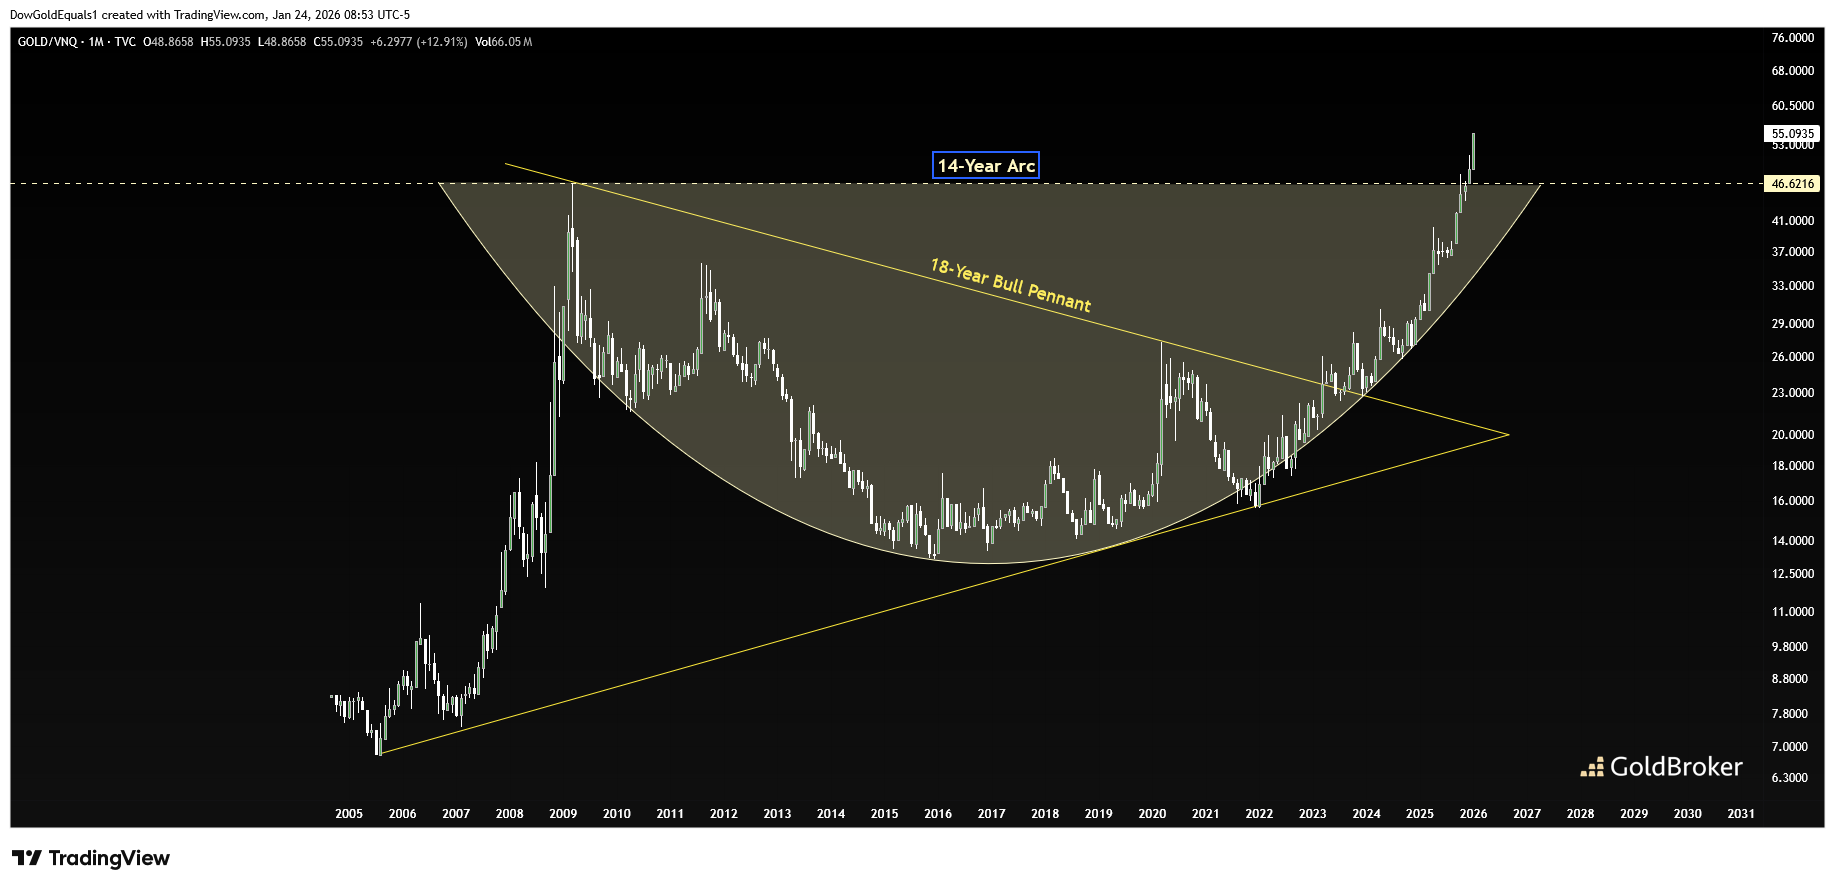
The next chart is the ratio of gold to VNQ, the Vanguard Real Estate ETF. If we're looking for clues about real estate going forward, this chart just might be it. Here, we see that the ratio broke out of an 18-year bull pennant in 2023 and has just this year emerged from a 14-year arc to set all time highs. Whereas MSPUS/Gold leaves room to suspect real estate might be soon finding its bottom, Gold/VNQ is clear that gold is just getting started against real estate. Given real estate's losses to gold over the past quarter century, this is astounding.
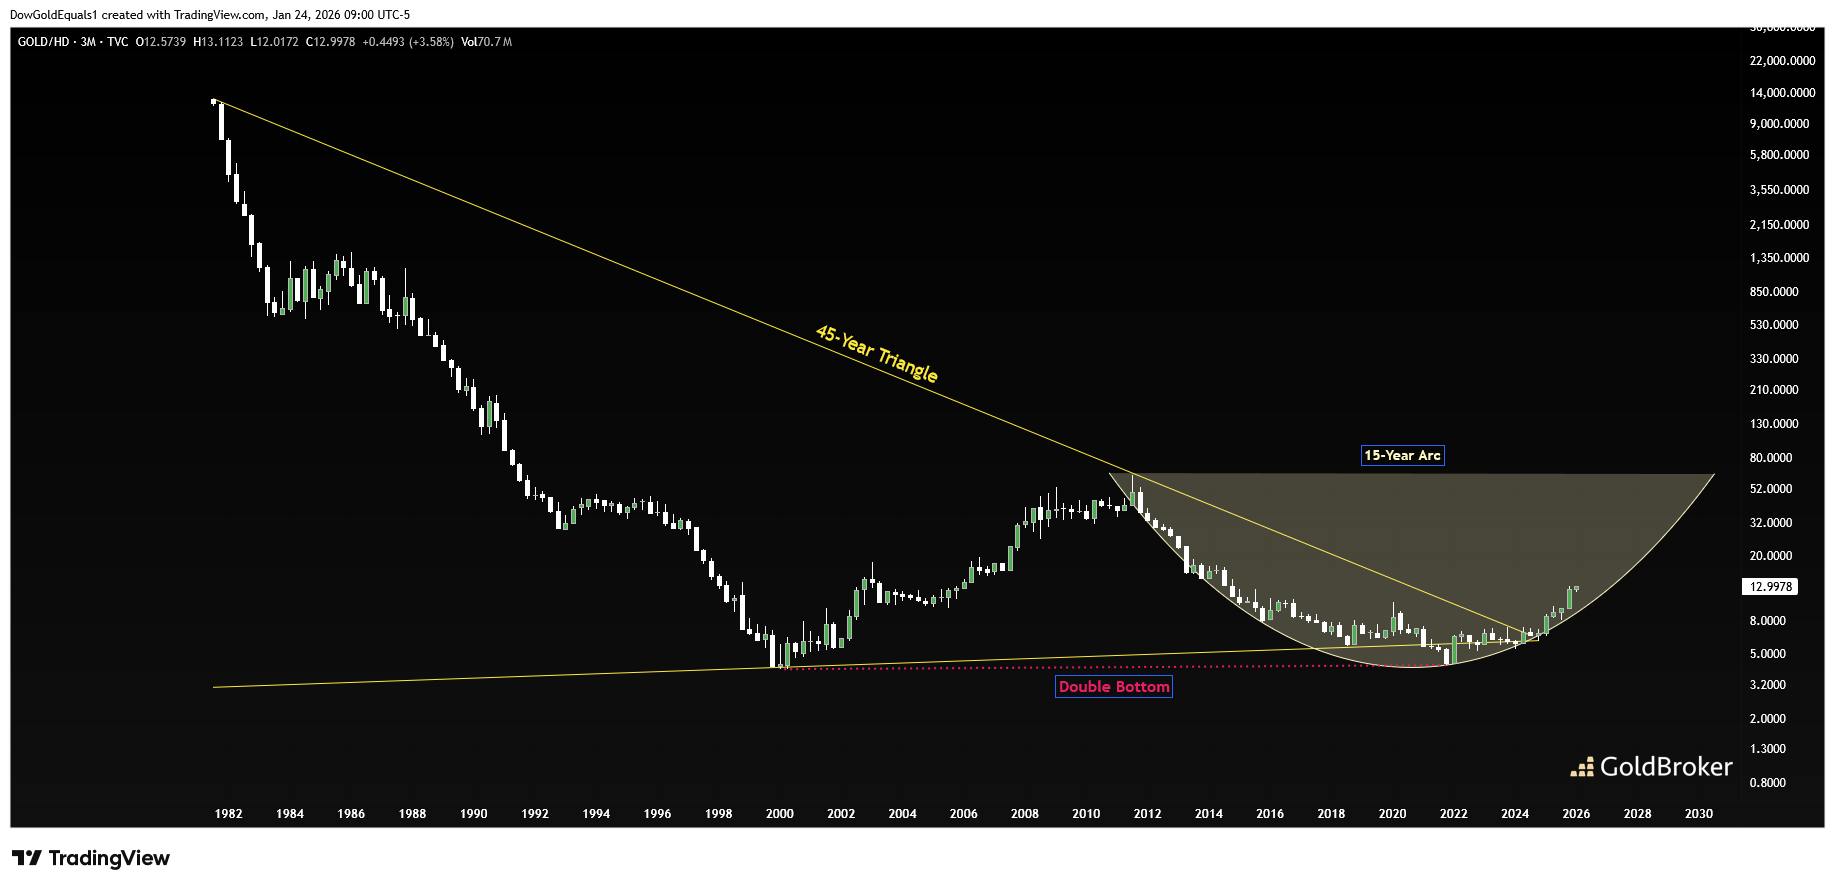
The last chart is the ratio of gold to Home Depot stock, a great proxy for the health of the real estate sector. Here we see that the ratio emerged from a 45-year triangle in 2024 and has been tracing a neat looking arc over the past 15 years. Most notable is the apparent double bottom (2000, 2022) which coincided with major tops in the US housing sector. Should this ratio continue to drift higher, which is its current path of least resistance, that would spell major trouble for real estate going forward.
Gold has been in a major bull market for 25 years, and one day that bull will end. Compared to US real estate, at least, the bull appears to have many good years ahead of it.
Reproduction, in whole or in part, is authorized as long as it includes all the text hyperlinks and a link back to the original source.
The information contained in this article is for information purposes only and does not constitute investment advice or a recommendation to buy or sell.


