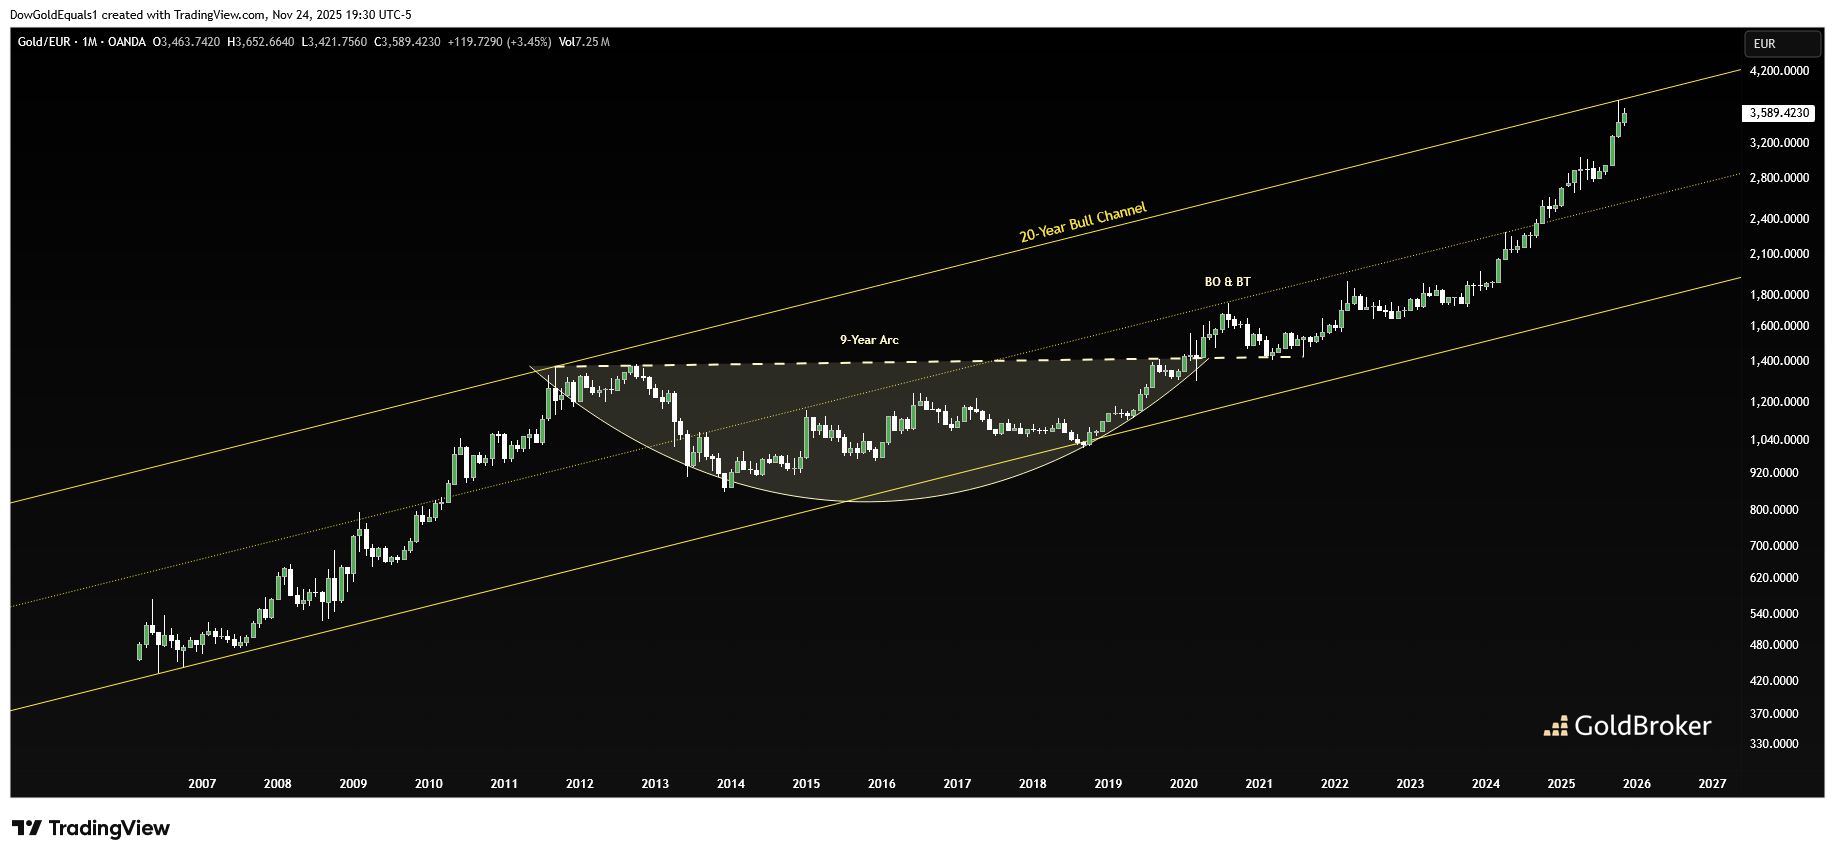
This week, we'll take a look at Gold/Euro, as it now finds itself at a critical juncture in its secular bull market. I have defined this monthly candle chart as a 20-year bull channel with clean touch points at each rail. The channel shows some very nice technical symmetry, as price moved impulsively higher during the early-2000s, consolidated those gains within a nine-year arc, and exited with a similarly impulsive leg higher off the Covid lows. Last month, price hit the upper channel rail and was sternly rejected, signaling strong resistance at this upper boundary. Given this historic price action, investors would not be blamed if they began to wonder if the secular bull in Gold/Euro might be over. For it to continue higher, price would have to break out of an already steep ascending channel. Can it?
The next four charts of gold priced in other major world currencies: JPY, CHF, CAD and AUD. In each case, price can also be defined as a very steep long-term ascending bull channel. However, all four of these have already broken out to the upside. This evidence suggests that the global secular bull market in gold in alive and well and, in fact, may just now be starting a blowoff phase that could last several years. With Gold/Euro follow suit? I believe that is just a matter of time.


The bull market in gold that began 25 years ago appears to have more legs, and its most impulsive price action might just be ahead of us.
Reproduction, in whole or in part, is authorized as long as it includes all the text hyperlinks and a link back to the original source.
The information contained in this article is for information purposes only and does not constitute investment advice or a recommendation to buy or sell.


