Debate on social media has been hot about whether Gold's current correction from its all time high around $3,500 set in April to near $3,100 this month has another leg down or if the worst may be over. This week, we'll look at a chart of gold and a chart of the Gold/Silver ratio to see if we can identify some clues.

The first is a daily chart of gold, which I have defined as an ascending channel that began in July of last year. Here, we get a good look at gold's strong rally from below $3,000 in early April of this year to more than $3,500 in just a couple of weeks. It is no surprise that gold has corrected in order to consolidate some of those gains. The current consolidation is taking on the form of what appears to be a bull flag while perfectly backtesting the lower rail of the channel. This is elegant technical action and perfectly healthy bull market behavior. If we are looking at a halfway flag, the next rally could mirror the strength of the April sprint, and we could see gold back above $3,500 over the next few weeks.
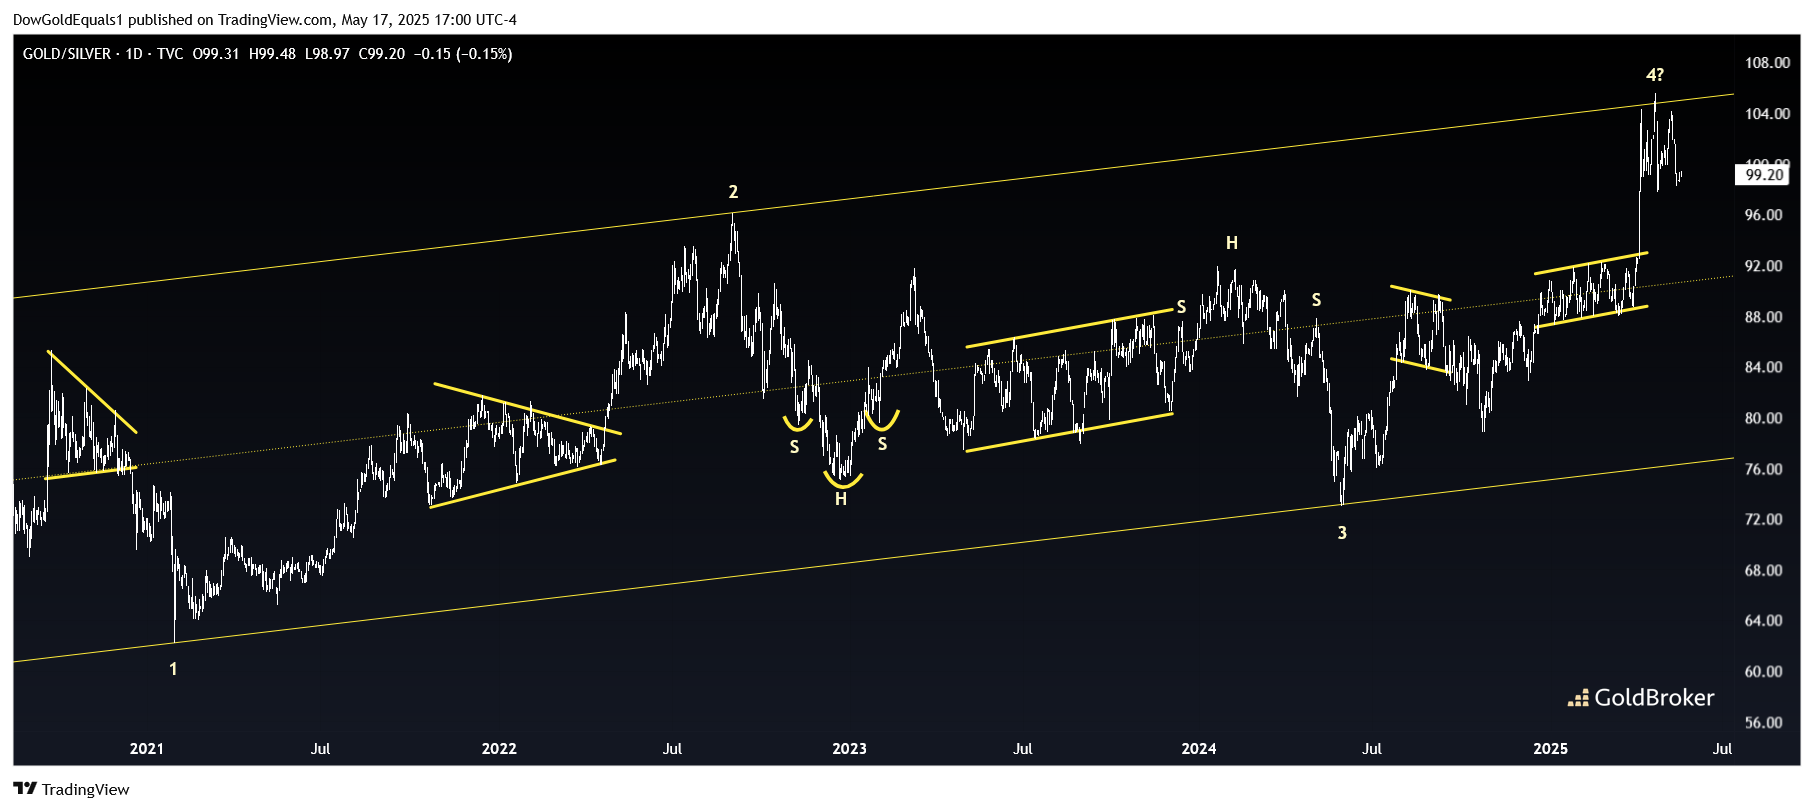
The second chart is also a daily — that of the Gold/Silver ratio. Sometimes when the future direction of gold and silver are not clear from their respective charts, the ratio can provide additional clues about the next move. This chart I have also defined as a 4-point channel, with this one going all the way back to 2020. The larger the pattern, the more important it usually is, so this multi-year channel is a stronger piece of evidence than the smaller channel we looked at in gold. Since the outer rails only have a couple of touchpoints each, note that I have highlighted the midline price action to further validate the channel. In this case, I was able to note seven important consolidations around the midline that combine to provide a very strong argument that this is an important channel. That said, it appears that we may have just seen Point 4 take shape with a strong bounce off of the upper rail. This would seem to put the midline back in play, and potentially a trip all the way back to the lower rail. Just a return to the midline would likely mean that the current correction in Gold is indeed over.
So will we see the additional $300-$500 decline in Gold that some of the popular internet analysts have been calling for? Anything is possible, but in my humble opinion, I would say that we should be looking higher from here.
Reproduction, in whole or in part, is authorized as long as it includes all the text hyperlinks and a link back to the original source.
The information contained in this article is for information purposes only and does not constitute investment advice or a recommendation to buy or sell.


