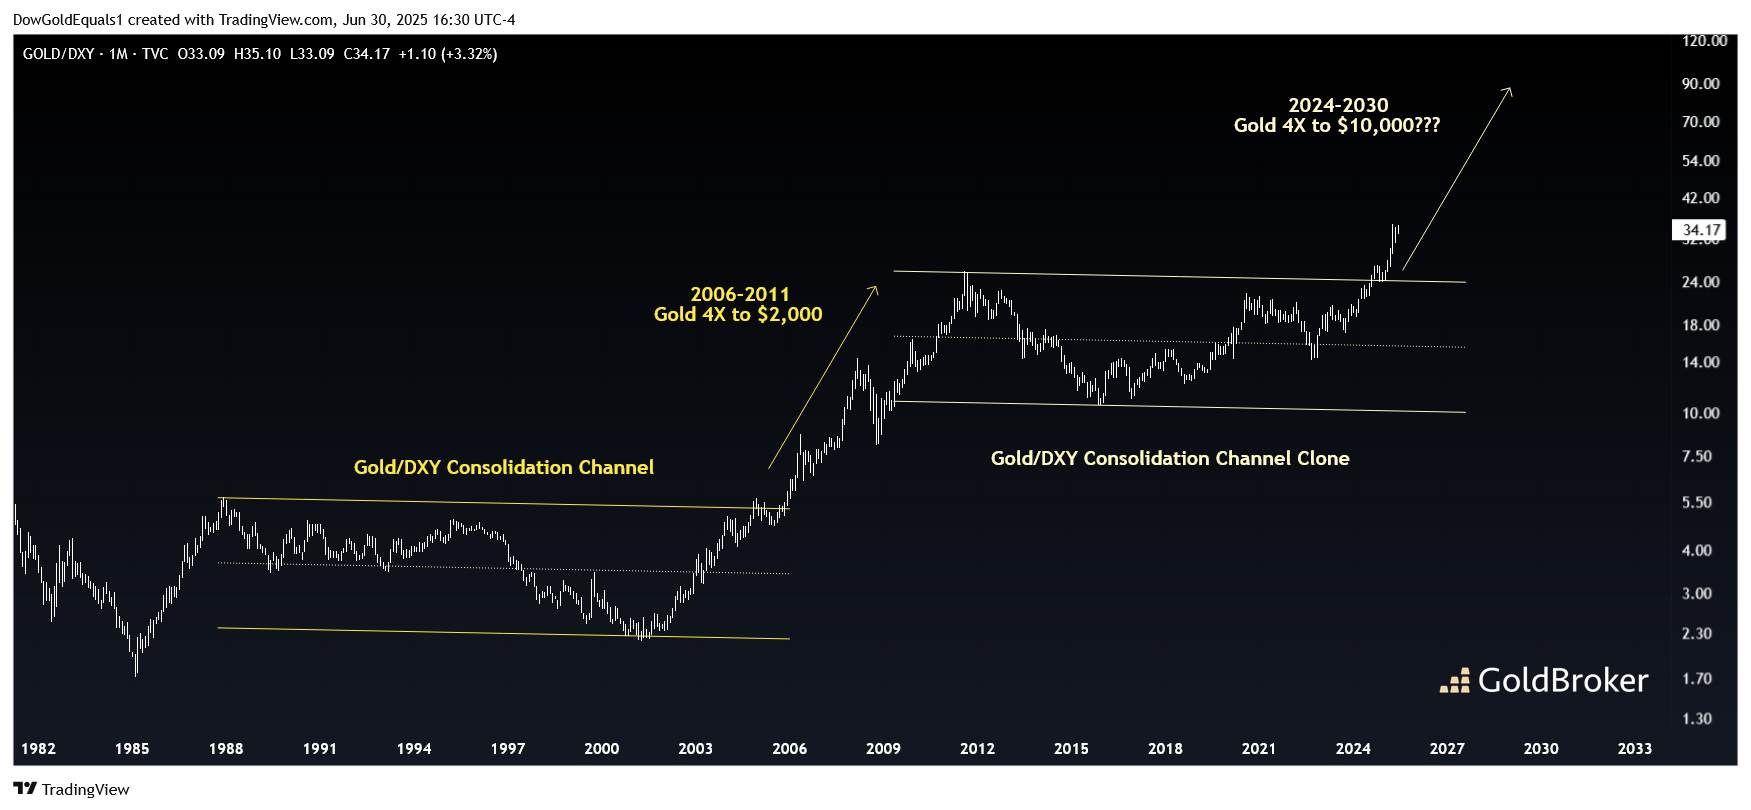
This week, we will look at a couple of gold ratio charts that suggest we may be entering into a mania phase in the yellow metal that could run for several years. The first is that of the gold price vs DXY. DXY itself is a ratio chart that compares the US Dollar to a basket of international currencies. When DXY is increasing, the US Dollar is gaining relative strength. For Gold to be in a bona fide bull market in US Dollar terms, we need to see it outperform DXY in addition to rising in nominal dollars. This is a fascinating chart that shows we have just exited a 15-year consolidation channel in impulsive fashion. Amazingly, this channel is a clone of the channel Gold/DXY carved out from the late-1980s until it blasted off in 2005. Back then, the breakout led to a 4X move in Gold over just six years. Given the recent breakout occurred in late 2024 around $2,500 Gold, a similar move would target $10,000 by the end of this decade!
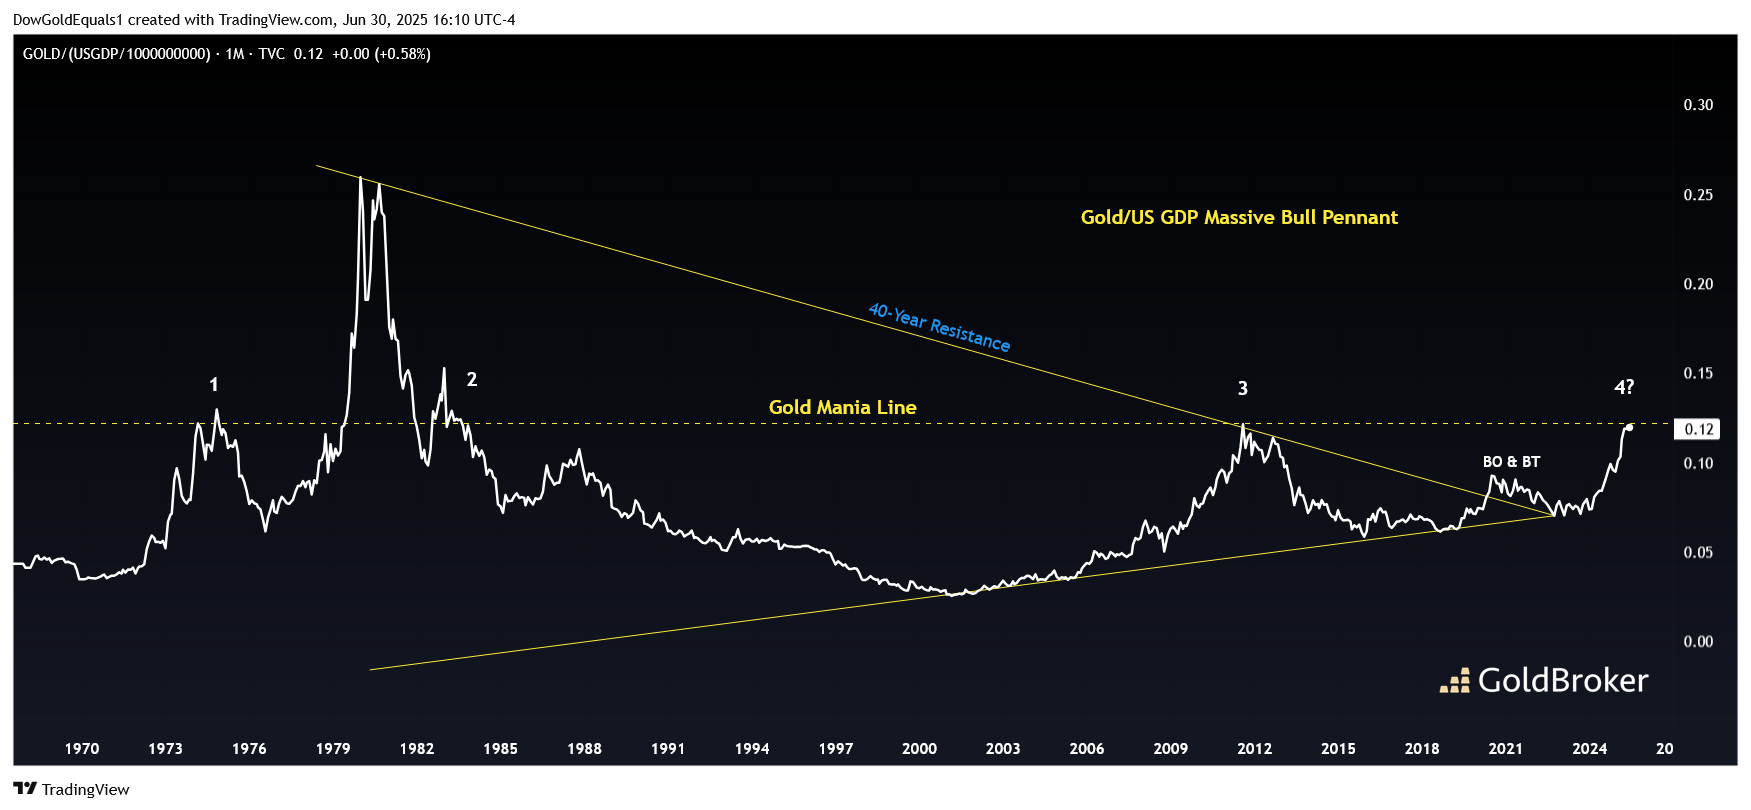
The second ratio chart is that of Gold vs US Gross Domestic Product. Again, for a run in Gold to mean anything relative to inflationary pressures, Gold must rise against US GDP and not merely in nominal dollars. I have defined the chart as a massive bull pennant that has seen a breakout, backtest and impulsive launch off the pennant apex over the past few years. The ratio now finds itself at where I have called a "Gold Mania Line." We can see that the ratio has flirted with this line throughout history and has been rejected 3 previous times. However, the one time the ratio escaped this heavy resistance was in 1979 when Gold managed a 3X move in just six months during its blowoff top. Should the ratio overcome resistance again, a similar move again targets approximately $10,000 gold, but in a much smaller time frame than our first chart.
Keep a close eye on both of these charts, as Gold Mania may have indeed arrived!
Reproduction, in whole or in part, is authorized as long as it includes all the text hyperlinks and a link back to the original source.
The information contained in this article is for information purposes only and does not constitute investment advice or a recommendation to buy or sell.


