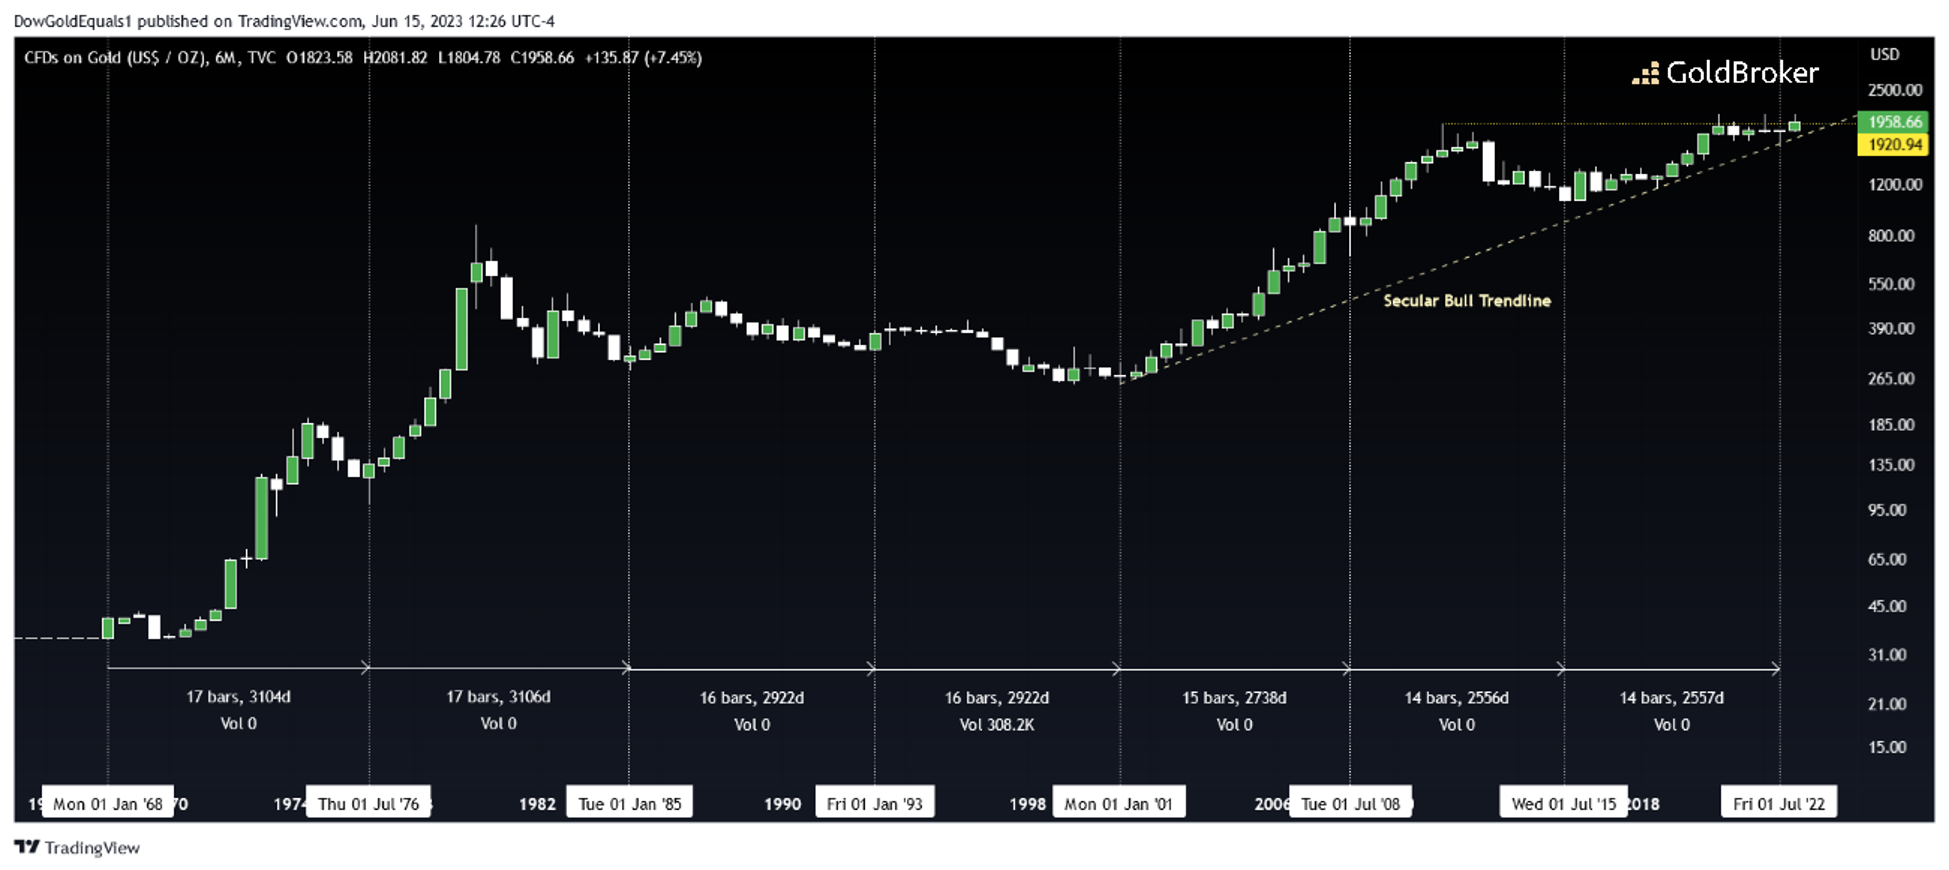
There is plenty of chatter on social media about Gold's "Eight-Year" cycle, whether or not it exists and just how meaningful it is. With that in mind, I want to show you exactly what that cycle looks like on a chart and what it suggests. On a six-month chart, we can see that Gold indeed has recorded significant long-term bottoms on somewhat regular intervals of 14-17 bars (7 to 8.5 years) since the yellow metal began freely trading in 1971. That this has occurred at least six times, and quite possibly a seventh, suggests that there is a meaningful rhythm to Gold's price movement.
There are two key pieces of evidence that support the low made in September, 2022 being a long-term cycle low. First, that low hit perfectly off Gold's secular bull trendline going back to 2001. Second, Gold is well on its way to completing a green six-month candle for H1, 2023 that could see price close above a historical high set in 2011. Should this happen at the end of this month, we may have another clue that we can anticipate strong price action as Gold seeks a cycle high over the next several years to come.
Silver's Bull Flag Breaks Out
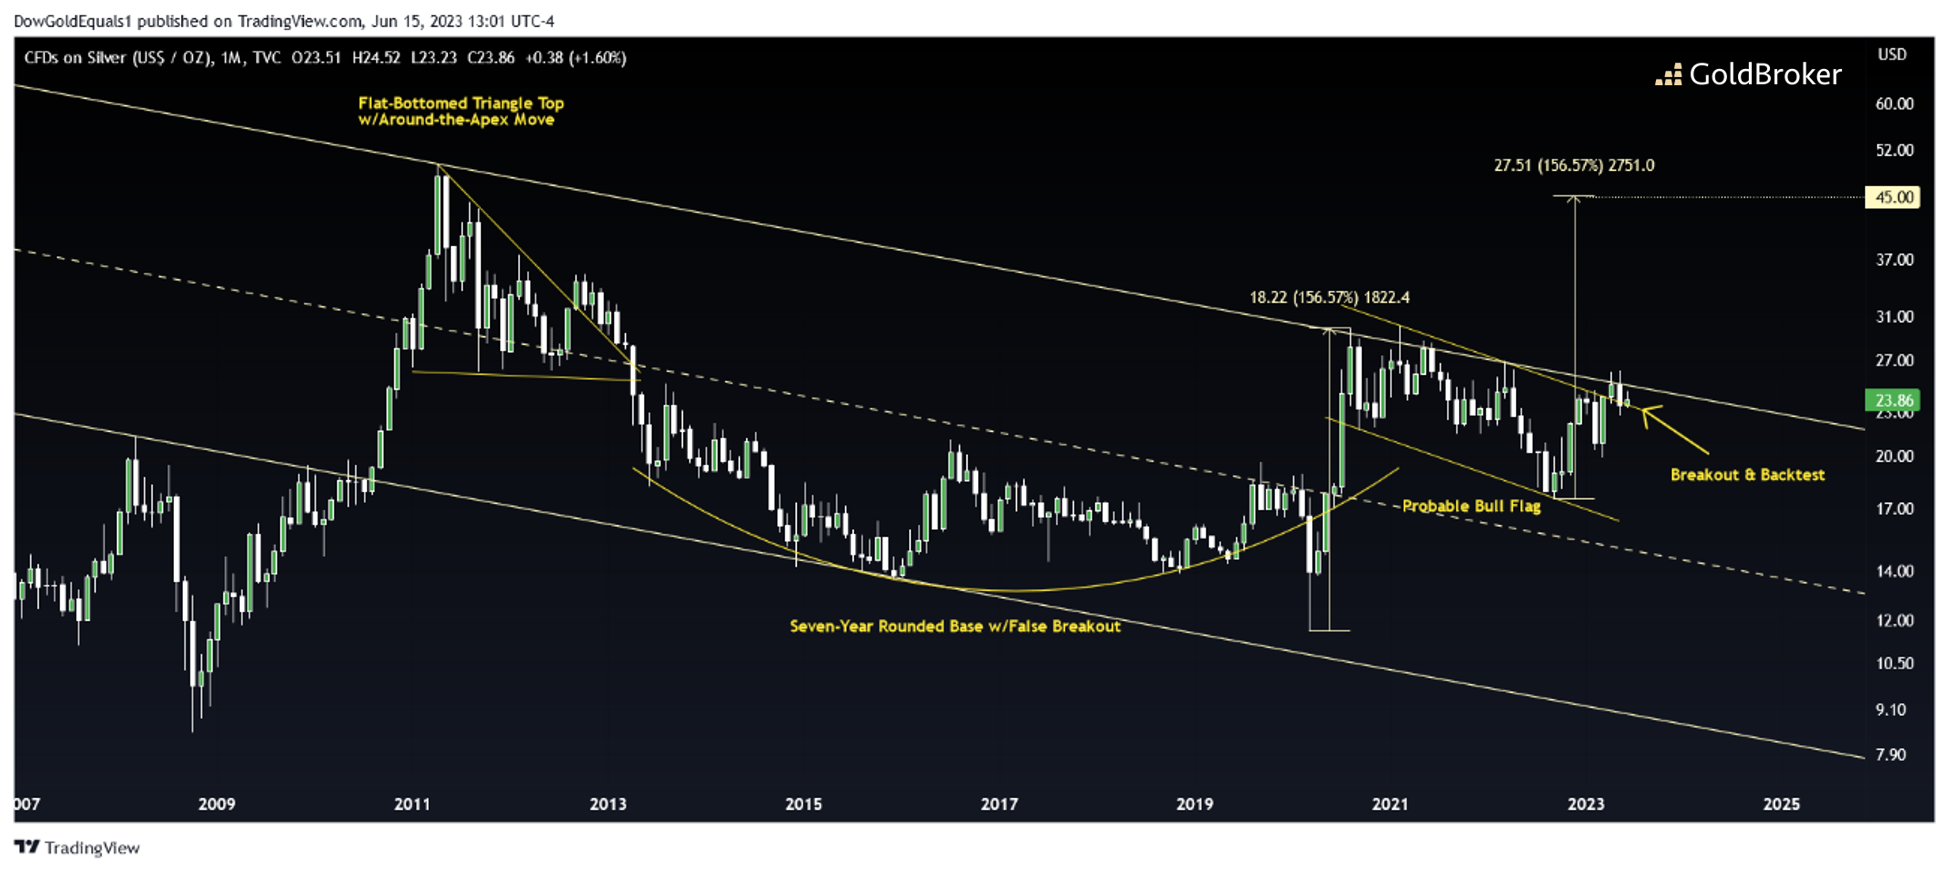
I want to update you on a silver's price chart posted in February that is tracking a large, probable bull flag. Over the past few months, we can see that the bull flag has broken out to the upside and is now backtesting that breakout. This is very healthy bull market action. Should the backtest hold and follow with an impulse move higher, the measured move remains to the $45-area.
Reproduction, in whole or in part, is authorized as long as it includes all the text hyperlinks and a link back to the original source.
The information contained in this article is for information purposes only and does not constitute investment advice or a recommendation to buy or sell.


