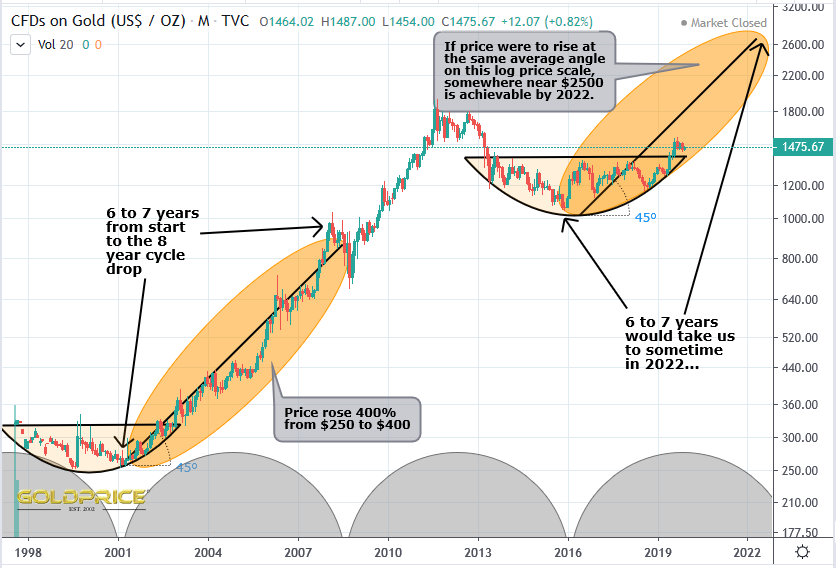
What follows are charts laying out my views for the gold price in 2020 and beyond. The first compares the base breakout in 2002/2003 to where we are now - I’ve highlighted the 6 to 7 year advance that followed, which, if repeated, takes us into 2022…
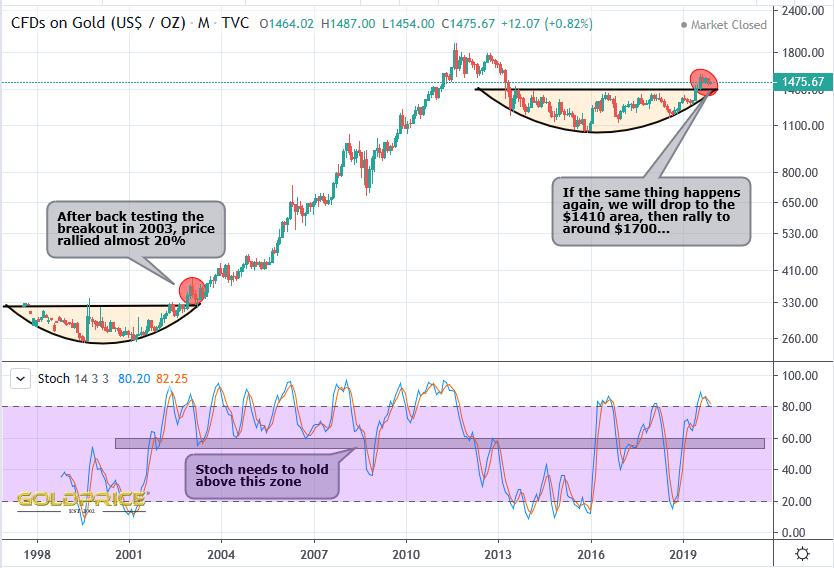
Next up, I’ve highlighted those breakouts and added the Stochastic Indicator…
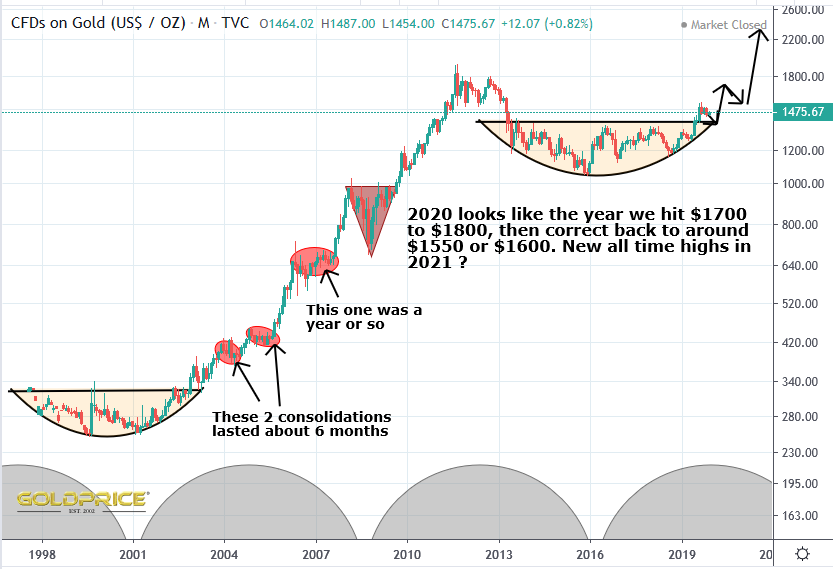
So, my theory is that we advance 20% or so from current levels, taking us to around $1700. We may overshoot towards $1800, but we’ll have a better idea nearer the time if that’s looking likely. New highs follow in 2021 after a lengthy consolidation...
Original source: Northstar - Twitter
Reproduction, in whole or in part, is authorized as long as it includes all the text hyperlinks and a link back to the original source.
The information contained in this article is for information purposes only and does not constitute investment advice or a recommendation to buy or sell.


