
We can see on this graph that, until 2011, each time gold seemed to be surging up there would be a correction, which is the mark of a sound bull market. On the other hand, from a fundamental point of view, or from a portfolio allocation or psychological point of view, gold was far from filling the criteria of a bubble. Graphically, many bubbles are recognised as such if we use a logarithmic scale, which shows that the returns are getting higher and higher as we near the top. For comparison, below is a chart of the U.S. tech-bubble of the 1990’s and the oil prices shooting higher in 2008, following mainstream media hype about peak oil :

The oil bull market is far from over, for fundamental reasons, but its « parabolic » rise in 2008 has resulted in a soon-to-be six-year pause in its race ahead, giving time for the media to be talking about something else... The more an asset is talked about and has become unavoidable, the more time is needed to rebalance sentiment and rebuild a « wall of worry » that bull markets love to climb!
As for gold, one cannot deny that this wall of worry has become a fortress of worry in this early 2014, and the bull market will have something to grab and climb on! For example, the banks’ pessimistic forecasts for the price of gold at the end of 2014 do foretell the basement sentiments regarding the gold market. All this bodes well for a long-term bull market!

Has gold become too expensive at $1,250?
I find it amusing to see how quick the media is shouting « bubble! » on an asset that had declined by 87% between 1980 and 2001 and that had only recouped half of its value of 1980 (adjusted for inflation).
The reality is that, in 2000, gold had never been so undervalued since 1970. According to my calculations, based on money supply and global gold reserves, gold should have been worth $274 an ounce in 1970 instead of $35. The theoretical potential rise was 680%. In 2000, gold should have been worth $1,800 instead of $270, for a theoretical potential rise of 560%.
")
We are now in the same situation as we were in in the ‘70s, just before the final leg of price retracement.
This chart starts with the creation of the Federal Reserve in 1913. Before the Fed, I believe the price of gold was fixed more or less correctly, since we were under a gold standard. We can see, on the next chart, how the price of gold diverged from its theoretical price as soon as the Fed started to use the printing press. During the correction cycle of 1929 the Fed had to devalue the dollar against gold because of deflation in order to reduce the weight of the debt, which caused the theoretical price to join the real price for a few years.
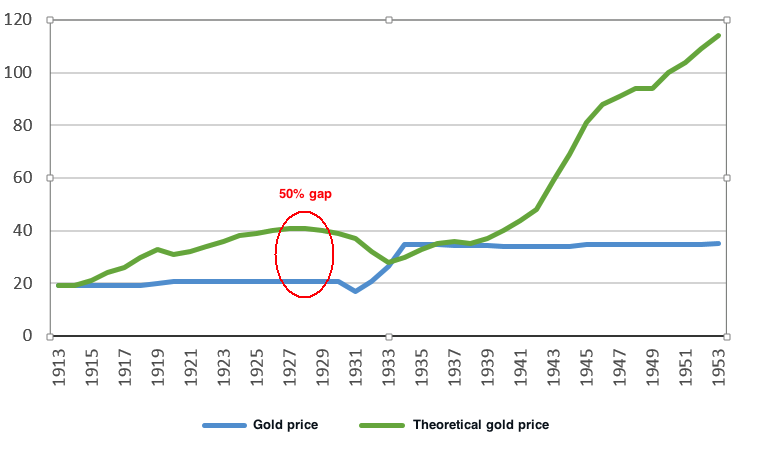
After which the increase of the monetary mass and the artificial fixing of the gold price led to widen the gap even more, until the early ‘70s. In 1980, gold was back to its theoretical price, due to the anticipation of a return of gold into the monetary system. But the economy could still live with a new investment cycle using the « paper dollar » as world reserve.
Today, bills are due, a winter cycle is back, and gold has awakened. This metallic colossus never arises for naught, notwithstanding those who would like to see it go back to its long autumnal slumber of 1980-2001. No central bank, however powerful and defensive of its currency, will be able to keep its fiat money from ending its life of debauchery and excesses on the judgement par of the only real money reserve... gold, that is.
Jim Sinclair, a.k.a. Mr. Gold, one of the world’s greatest experts on the gold market, predicted as soon as 2000 that gold would rise to $1,650, using totally different valuation methods than mine. Let’s also recall that Jim Sinclair had perfectly predicted the rise of gold in the early ‘70s as well as its final peak in 1980!
So where are we today? In February 2014, my theoretical price for gold is $3,400, for a potential hike of 170% from $1,250. And « Mr. Gold » revised his price target to $3,500 in 2013, with the caveat that it could go all the way up to $50,000, were a monetary crisis to provoke a violent fall of the dollar.
I think that it will all depend on the Fed’s reactive money printing : If the U.S. monetary mass continues to swell, my price target will just keep going up! And since we’ve entered a correction phase with deflationary pressures since around 2000, the Fed will have to print massive amounts to counter the destructive deflationary strengths. Print or die under the weight of the debt, this is the only choice!
The current cycle is different than the ‘70s one in that it won’t be visible inflation fueling the rise of gold as much as bankruptcy risks and general loss of faith and trust in the whole of the financial system and the fiat monies. The economist Kondratieff would have talked about a summer correction cycle for 1966-1982, and about a winter correction cycle since 2000 that should end between 2015 and 2020. Summer correction cycles are the worst ones for stock market investments, the last one to date being the one from 1929 to 1949.

Let’s just recall that during every correction cycle, whether winter or summer, the gold price has ended by reaching its fair theoretical price.
>> READ PART 2: THE CENTRAL BANKS' GOLD RESERVES
Reproduction, in whole or in part, is authorized as long as it includes all the text hyperlinks and a link back to the original source.
The information contained in this article is for information purposes only and does not constitute investment advice or a recommendation to buy or sell.


