Several of the major central banks are stuck in a trap of their own making.
This includes the US Federal Reserve, the Bank of Japan, the European Central Bank, and others.
The credit-based global financial system we have constructed and participated in over the past century has to continually grow or die. It’s like a game of musical chairs that we have to keep adding people and chairs to in order for it to never stop.
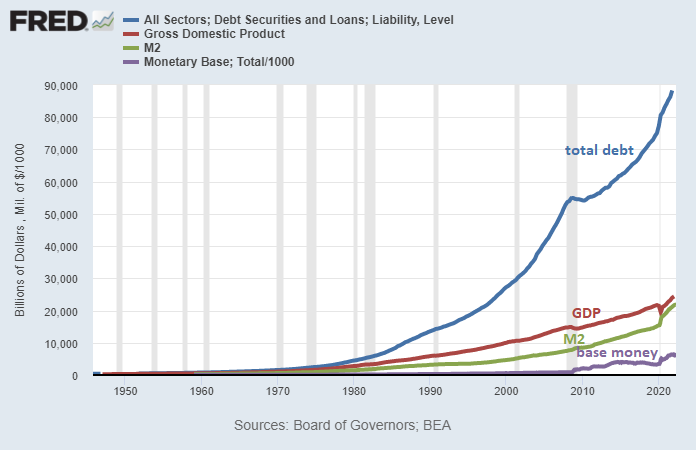
This is because cumulative debts are far larger than the total currency supply, meaning there are more claims for currency than there is currency. As such, too many of those claims can never be allowed to be called in at once; the party must always go on. When debt is too big relative to currency and starts to get called in, new currency is created, since it costs nothing other than some keystrokes to produce.
It’s like this for most major countries:

Chart Source: St. Louis Fed
In other words, claims for dollars (debt) grows far more quickly than the economy’s ability to generate dollars, and is far larger than the amount of dollars in existence. When this becomes too much of a problem, the amount of base money is simply increased by the central bank.
Base money is a liability of the central bank, and it’s used as a reserve asset by commercial banks. Broad money is the liability of commercial banks, and it’s used as a savings asset by the public. Treasuries are liabilities of the federal government, and they’re used as collateral by the central bank and commercial banks.
In other words, liabilities are collateralized by other liabilities, all the way down.
Further reading on this:
Central banks place guardrails on either side of that credit growth, trying (and often failing) to ensure that it doesn’t grow too quickly into a bubble or falter into a deflationary spiral of defaults. They want smooth credit growth with perhaps some mild cycles along the way, and smooth 2% average annual currency devaluation.
For decades, whenever economic growth was sluggish, central banks would reduce interest rates and encourage more credit growth (a.k.a. debt accumulation) which leads to spurts of economic growth. Whenever the economy was booming, they would increase interest rates and discourage credit growth, to try to cool things off.
The problem is that this level of micromanagement, with an understanding that the core system would always be bailed out if need be, contributed to higher and higher debt levels relative to GDP, both in private and public realms, and lower and lower interest rates.
During the past four decades, the increase in debt over time was always offset by reductions in interest rates, so that the cost of servicing that debt never really went up.
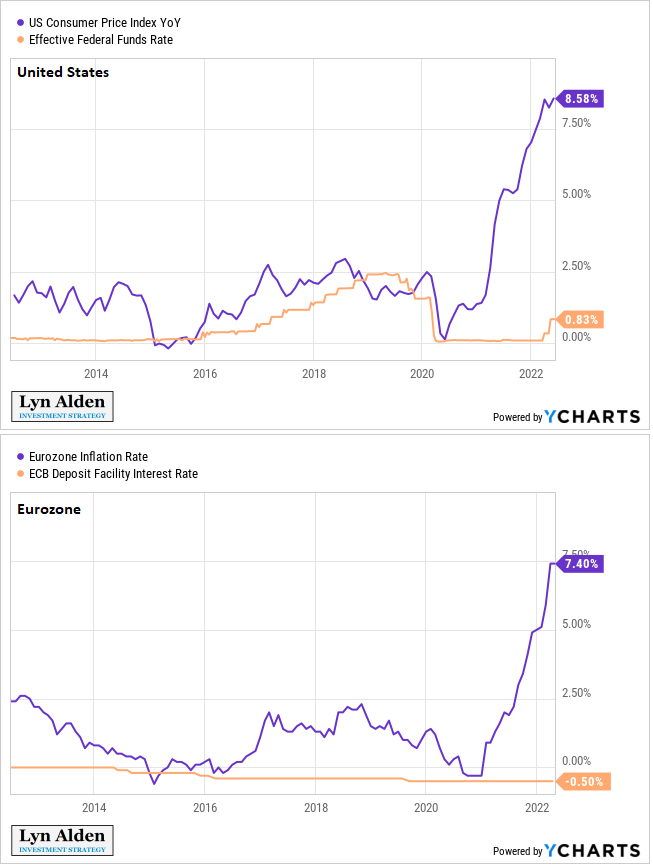
Eventually, however, major central banks all reached zero or even slightly negative interest rates, and there wasn’t realistically any lower to go. Any further debt increases at that point would be hard to offset by lower interest rates. The cost of serving the debt relative to GDP and incomes would actually start to rise.
In addition, if the world ever did run into a significant setback in productivity, such as through de-globalization or underinvestment in commodities which we are seeing now, then the resulting inflation would be hard to offset with increases in interest rates.

Chart Source: YCharts
We haven’t seen this level of disconnect between inflation and interest rates since the 1940s, which is the last time that sovereign debt as a percentage of GDP in the developed world was as high as it is now.
So, much like the 1940s, many developed market central banks are trapped. They can’t raise interest rates persistently higher than the prevailing inflation rate, and instead are stuck with slowly moving interest rates up, jawboning forward guidance, yield curve control, and trying to inflate some of the debt away.
However, the European Central Bank arguably has the hardest job of all.
This was very apparent in the head of the ECB Christine Lagarde’s recent interview.
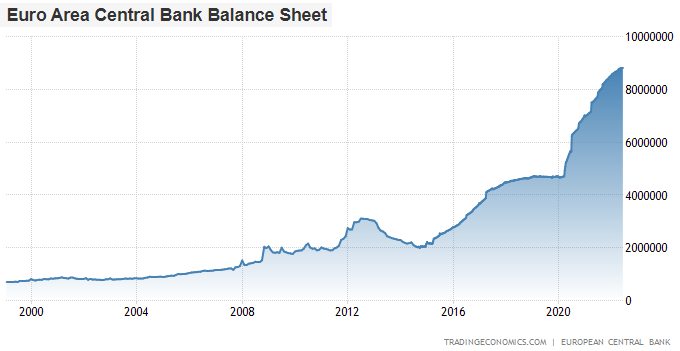
She was asked, “how will you get the balance sheet down?” while being shown the ECB balance sheet on a screen.

Chart Source: Trading Economics
She answered, “It will come. It will come. In due course, it will come.”
The interviewer paused, confused, and then asked, “…how?”
And she answered, “In due course, it will come.” And then smiled.
She offered no answer, no description, no clarification, and had rather awkward expressions throughout the exchange.
This is because, like most central banks, there is no plan. It won’t come. Sovereign debt will be monetized to whatever extent it needs to be, or it’ll collapse. And for the ECB it is particularly tough, because they have to monetize debts of specific countries more-so than other countries.
A Monetary Union Without a Fiscal Union
Countries in the Euro Area have given up monetary sovereignty. Instead of maintaining their own currencies, they have agreed to use a shared currency, and thus a shared central bank.
This came with pros and cons, but due to the way it was structured, it has been politically unstable from the beginning.
The United States can unilaterally print dollars. Japan can unilaterally print yen. Their governments can heavily influence their central banks as needed. But Italy, for example, cannot unilaterally print euros or heavily influence the ECB on its own.
At first glance, this doesn’t seem so different than US states. Texas, California, New York, and other states can’t print dollars. So what’s the big deal if Euro Area countries can’t either?
Well, the difference is that the US mostly has a shared fiscal union in addition to a shared monetary union, whereas Europe mostly does not have a shared fiscal union.
US states share most of the same retirement, entitlement, and defense systems. Residents of all states pay into Medicare and Social Security, as well as the US Armed Forces, which collectively constitute the vast majority of federal government spending. Citizens of the US are not citizens of any specific state; they can move freely around the country under what is mostly the same entitlement system. In contrast, these entitlement systems very much differ between European countries.
At the end of the day, it’s the debt difference due to this lack of fiscal union that matters. European countries had higher debt levels when they became a monetary union, and they’ve only gone up since then.
Here are the top five US states by GDP, in terms of their state debt as a percentage of state GDP.
- California: 5%
- Texas: 3%
- New York: 8%
- Florida: 3%
- Illinois: 7%
And here are the top five European countries by GDP, in terms of their national debt as a percentage of their national GDP:
- Germany: 70%
- France: 113%
- Italy: 151%
- Spain: 118%
- Netherlands: 52%
The percentages of both US states and European countries can be increased further if we account for off-balance-sheet entitlement liabilities expected to occur in the future. These are basically debts that haven’t been marked to market yet. We can also include local debts in both calculations.
But regardless of how we calculate it, there’s a gaping difference in debt levels of US states and debt levels of European countries. In the US, public debt is mainly at the federal level rather than the state level, whereas in Europe, public debt is mainly held at the individual country level, and they don’t have individual central banks with unilateral base money creation ability.
In addition, commercial banks in Europe hold individual sovereign debt as a key part of their collateral. Meanwhile, commercial banks in New York, for example, don’t hold New York state debt as a key part of their collateral. They use Treasuries as their key collateral.
This shows how the situation is hardly comparable on this point. Most US states do not need debt monetization by the Fed to remain solvent. At some point, some of them may run into pension insolvencies, but that’s a not quite as structural of an issue. Several European countries, however, do need persistent debt monetization by the European Central Bank to remain solvent year-by-year. And by extension, that spreads out to the whole commercial banking sector.
To be clear, the US has a host of problems. I’ve written numerous articles about how the petrodollar system has undermined US manufacturing more-so than the rest of the developed world, for example. Unlike Europe, the US has run a structural trade deficit for decades and has a deeply negative net international investment position. The US is also more financialized than Europe in the sense that our stock market is big enough to affect our economy rather than just the other way around. We’re so consumption-oriented, stock-oriented, and reliant on the foreign sector recycling our trade deficits into our capital markets, that the “tail can actually wag the dog” in this sense.
But in terms of the specific ability to cease sovereign debt monetization for periods of time, that’s where the ECB is near the bottom of the pack compared to other central banks. It’s a more complicated political issue.
Robin Brooks, the chief economist at the Institute of International Finance, and the former chief FX strategist at Goldman Sachs and a former senior economist at the IMF, has some of the best charts to illustrate this issue. The solvency of Italy’s sovereign debt is in the hands of an entity, the ECB, that Italy has no unilateral control over:
That's a good point, but the market disagrees with you on Italy. The market sees a country that de facto hasn't been able to place net new debt in private markets for many years, relying instead indirectly on ECB QE (blue) for funding. So the issue is market access for Italy... pic.twitter.com/lLSJzIy2Ua
— Robin Brooks (@RobinBrooksIIF) May 9, 2022
In the long run, I can’t imagine being a European investor and having sizable long-term exposure to the currency, especially within some of the southern European jurisdictions.
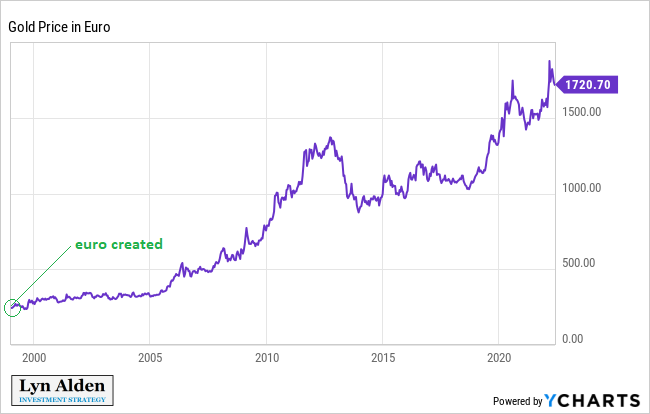
I’d much rather want to have real estate, profitable equities, commodities, gold, and bitcoin, than euros and euro-bonds. The same is true for the US, Japan, and other countries, but with Europe the currency comes with added tail risks, especially now that their energy security is seriously being put to the test.

Chart Source: YCharts
Original source: Lynalden
Reproduction, in whole or in part, is authorized as long as it includes all the text hyperlinks and a link back to the original source.
The information contained in this article is for information purposes only and does not constitute investment advice or a recommendation to buy or sell.


