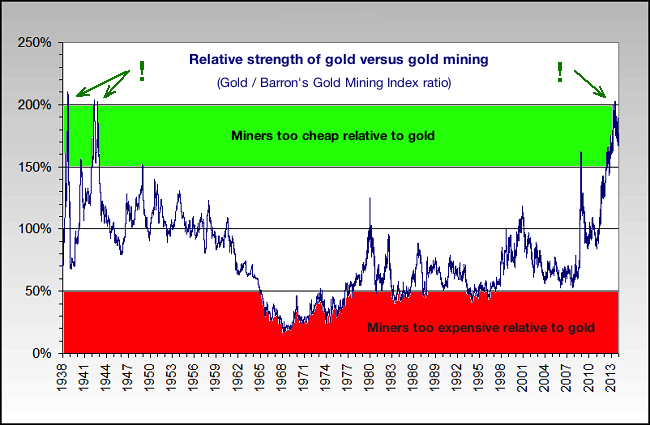
This chart by itself shows how much investors’ sentiment about the gold miners has reached a peak of pessimism not seen since 1943. Miners selling so cheap in relation to gold is a sign of historical capitulation all over the sector. Their valuations, in terms of P/E and business value, haven’t been this cheap for decades!
But we also must take into account that, for the last ten years, the mining sector has had to face major hurdles : higher energy prices, higher costs for construction material, higher taxes, lower-grade ore, not as many new discoveries to replace existing mines, environmental problems, and more difficulties in obtaining the required exploitation permits. So it would be normal that the ratio would be higher than in the ‘80s and ‘90s, but today’s level is just plainly absurd and can only be the result of capitulation from investors in this sector. As far as I’m concerned, this is a sign of a major bottom and constitutes an exceptional buying opportunity for physical gold and gold miners.
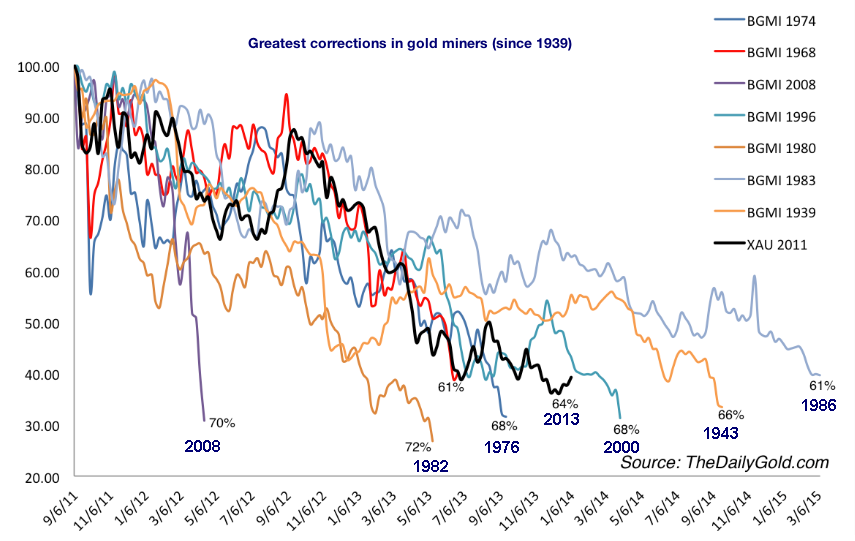
This chart shows that the 2011-2013 correction for the miners has almost reached the average intensity and duration of all past great corrections and that this sector is more poised to begin a very bullish movement rather than a great correction. As a matter of fact, each of those corrections were followed by rises, respectively, of 34%, 205%, 606%, 560%, 52%, 163% and 141%.
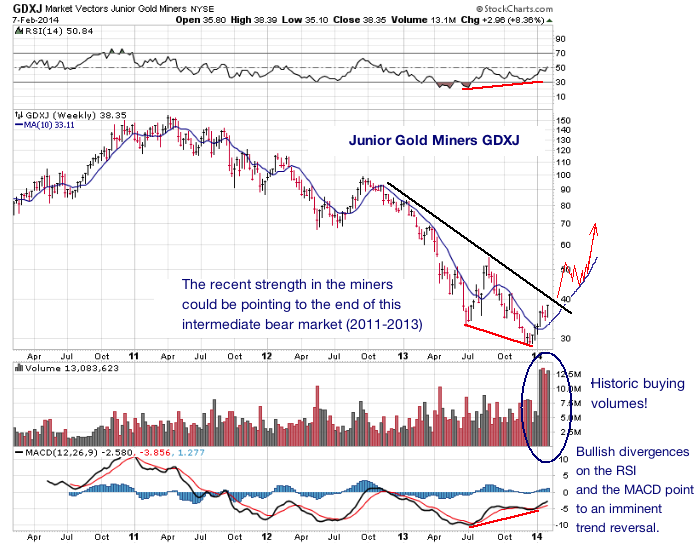
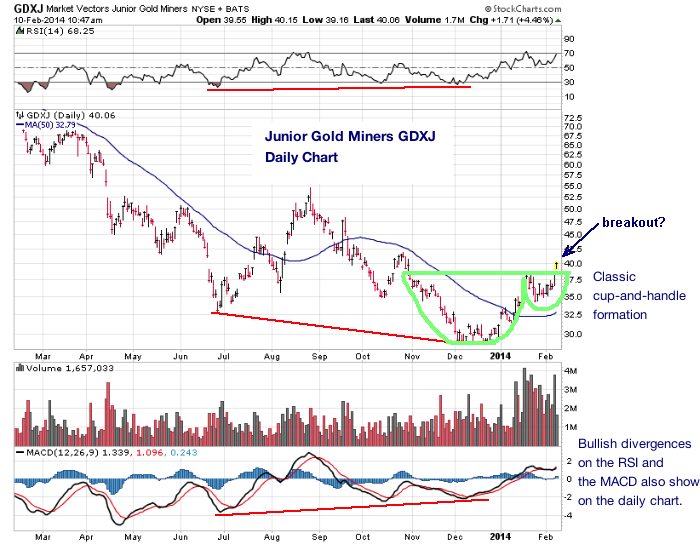
The junior gold miners, represented by the GDXJ ETF, are showing encouraging signs of reversal, which is validated by very important volumes.
Miners often anticipate the movements in the metal itself for the simple reason that the smart money (whether in the know about gold market manipulation, in the case of a bank, or just well informed by fundamental market analysis) will play the miners in parallel with their positions in the gold market. Since the mining sector is much smaller than the gold market, it has a tendency to react more quickly, thus showing us the way to go.
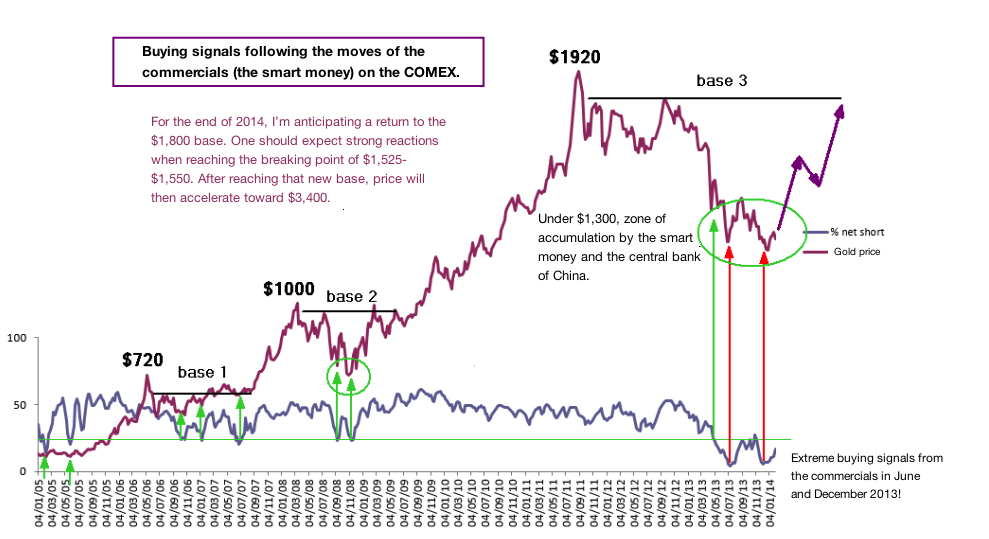
The movements of the smart money can also be followed on the COMEX by looking at the commercials’ positions. Up until 2008, when the commercials were reducing their net short positions to less than 25% of the open interest, this was a clear buy signal for me. In 2013, the commercials sent a buy signal (their first since 2008) when gold was at $1,525 an ounce. The smash-downs of April and June took them by surprise (like everyone else), but that made their buy signal the clearer in June, since it touched a low of 5%, not seen since 2001!
As far as I’m concerned, this low point indicates the physical limit to where the manipulators can stretch the elastic band. This limit was touched again in December 2013, but the successful testing of its trough in June indicates that the odds are good that this intermediate bear market in gold is definitely over.
Even though this correction took gold lower much lower than all analysts of the market anticipated, and even though this bearish exaggeration is due to some bankers determined to provoke the maximum of technical damage, we must not lose sight of the fundamentals, which have not changed in the least since 2011. On the contrary, gold has now even more reasons to fill the gap to its theoretical price... that went from $3,060 to $3,400 in 2013.
>> READ PART 1: WAS GOLD IN A BUBBLE?
Reproduction, in whole or in part, is authorized as long as it includes all the text hyperlinks and a link back to the original source.
The information contained in this article is for information purposes only and does not constitute investment advice or a recommendation to buy or sell.
