The next explosive phase in the precious metals market has just started. As always is the case, the beginning is so slow that only the wealth preservationists and the gold bugs are seeing it. But since these are less than 1/2% of world financial assets, it means that virtually no one is aware of what is happening.
The masses will be alerted when gold reaches $2,000 which won’t take very long. That’s when lazy journalists and MSM (Main Stream Media) will start writing about gold and at that point it will even reach the front pages. These reporters who can be from any country do not realise that gold in 2019 has reached new highs in most currencies except for in US dollars and Swiss Francs. But it is only a matter of time before gold will hit new highs also in these two currencies.
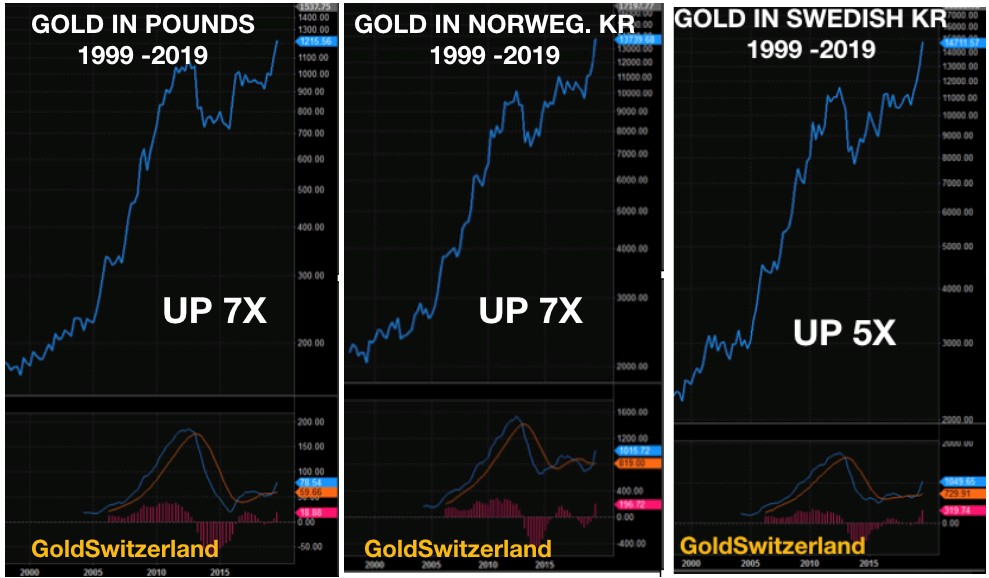
Gold should be measured in your home currency, for example in Euros, Pounds or Swedish Kronor, and not just in Dollars. Any journalist in the UK or Sweden will always quote gold in Dollars, not being aware that in this century gold has gone up almost 7X in both Pounds and Kronor and made substantial new highs.
GOLD’S 48 YEAR BULL MARKET HAS A LONG WAY TO GO
Gold has been in a strong bull market since 1971 when Nixon closed the gold window. Gold went from $35 in August 1971 to $850 in January 1980. A remarkable 24X increase in less than 9 years. Since 1980 gold was correcting that major move up and bottomed at $250 in 1999. And over the 48 years since Nixon’s fatal decision, gold is up 43X measured in paper money. But if we turn the chart upside down, it means that since 1971, the dollar has lost 98% in real terms, which is gold of course.
GOLD IN US $ 1971 – 2019 – FROM $35 TO $1,515 – UP 43X

WE DECIDED TO ENTER GOLD MARKET AT TURN OF THE CENTURY
As a business we decided in the late 1990s that we would enter the gold market for ourselves and the investors we advised. The reasons were simple, risk in the financial system was getting out of hand and we identified physical gold as the best investment to preserve or insure our wealth. Also, after a 20 year correction since 1980 gold was both severely undervalued and unloved at $250. So we watched the gold chart closely for a couple of years and decided when it reached $300 or £200 per ounce in 2002 that the market had turned and it was a good time to pounce.
We were so convinced at the time that we didn’t ease in to the market but went in in a major way. As the dollar weakened, gold went up more quickly in the beginning but from 2005 gold accelerated in all currencies and reached an interim top in 2011 at $1,920 and in Euros at €1,380 in 2012.
As I already mentioned, gold has recently reached a new high in Euros at €1,410 and in virtually all other currencies and we won’t have to wait very long before gold goes past the $1,920 high from 2011.
GOLD QUARTERLY CHARTS CONFIRM EXPLOSIVE BULL MARKET
At the end of the article I show quarterly gold charts in a number of different currencies. These charts clearly indicate that gold is in a long term bull market since the turn of the century. The charts show that the correction from 2011 has ended and the next leg of the bull market has started. This leg will last at least 5 years and probably longer and will be explosive.
The principal reason there will be an explosive gold market is that we will have implosive asset markets and unlimited money printing. Debts, stocks, property as well as paper money which are all massive bubbles are going to implode in real terms in the next few years and lose 75% to 95%+ against gold.
Virtually nobody in the world expects this whether they are so called financial experts, journalists or just ordinary people. This is because most people don’t understand that the asset explosion that the world has experienced in the last few decades is based on debt and money printing and has very little to do with real growth.
HOW CAN A HOUSE LOSE 95% IN VALUE
So what does it actually mean that a house will lose 95% in value, measured in gold?
The answer is very simple:
Property is a bubble asset and gold is undervalued.
In addition governments will in the next few years destroy paper money by printing unlimited amounts.
The consequence of all this is that property values will fall sharply and gold surge.
A $1 million house today costs approximately 20 kilos of gold.
Within the next 4-8 years, you will buy the same house for 1 kilo of gold thus 95% less than today.
What this actually means in paper money terms is harder to project today. That will depend on how much money that the US government/Fed prints and if $100s of trillions of US bank derivatives have imploded.
If you take the example of no hyperinflation and gold just going up 10x from today that would mean a value of $15,000 per ounce or $466,000 per kilo. So the $1 million house would in this example decline in value from $1M to $466,000 – a 53% decline. That certainly doesn’t seem such a big fall in relation to the enormous growth in property prices in recent years. But the key is of course that gold has gone up in value by 10x, leading to the house just costing 1 kilo of gold instead of 20 kilos today – thus a 95% decline in gold terms.
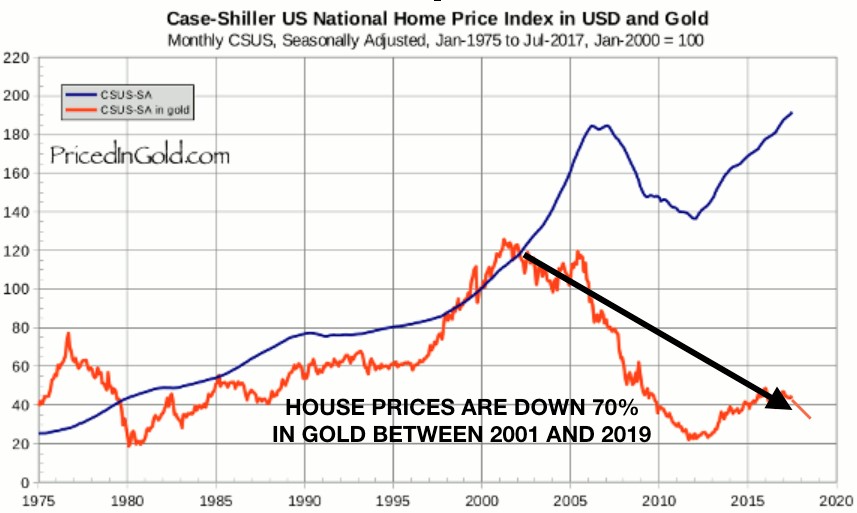
If we measure US Home prices in gold from 2001 to 2019, they have declined 70% in dollar terms during that period. So the 53% decline in the example above is probably too conservative. Thus, a 95% decline in gold terms in the next few years clearly doesn’t look unrealistic.
I PAID 21% MORTGAGE INTEREST IN 1974 – TODAY THE BANK PAYS YOU
But virtually nobody today could believe that this scenario is possible but in my view, it is not just possible but very probable. The booming global housing market is based on massive credit expansion and rates at levels that borrowers see as free money. In 1974, I paid 21% interest on my first mortgage in the UK. Today borrowers in Switzerland can get a 15 year mortgage well below 1% and a 10 year one at 0.5%. In Denmark you get paid 0.1% by the bank to borrow money for a house purchase. What a mad world!
NO SAVINGS MEANS NO INVESTMENTS
Anyone who has studied economics knows that, in a sound economy, savings equals investments. But who is going to save when they get at best zero percent interest and more likely a negative rate. Savings will totally dry out since anyone who has spare cash would rather buy risky stocks, or other investments.
GOLD WILL APPRECIATE BY AT LEAST 15% ANNUALLY
Very few people would consider owning gold today but that will change when gold goes past the previous high of $1,920. Just like in 2000 to 2011, gold will in the next 4-8 years go up by at least 15% annually and probably by a lot more. So who wants to stick money into insolvent banks and get negative returns or buy government bonds and pay the insolvent sovereign state for the privilege of lending them money.
STOCK INVESTORS WILL BUY THE DIPS AND GET SLAUGHTERED
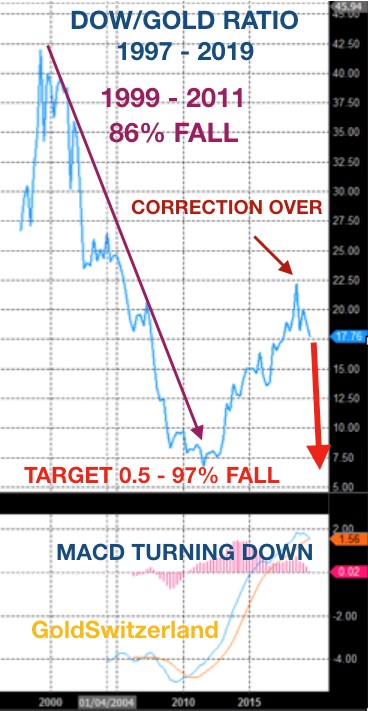
Initially a lot of money will go into stocks. When stocks start falling sharply, which is likely to happen this autumn, investors will buy the dips since this has worked for the last few decades. But this time it will be different as buying the dips will fail. Stocks will this autumn start a secular bear market which will be totally devastating. Against gold, stocks will lose at least 95% in the next 4-6 years. More likely more than 99% as the Dow/Gold ratio goes from 17.7 currently towards zero.
As the below chart shows, the Dow/Gold ratio was 44 in 1999 and has already declined 62% in the last 20 years. Virtually no investor is aware that gold has vastly outperformed the stock market this century. And as stated above, this trend will soon accelerate. But it will take a long time before stock investors realise that in stead of buying the stock market dips and getting burnt every time, they should own gold. The majority of investors will stay in stocks until they have lost all their wealth. The consequence will be a wealth destruction never before seen in history.
BOND MARKET IS THE BIGGEST BUBBLE IN HISTORY
The major problems in the world economy will start when credit and bond markets collapse. Initially Central Banks will add unlimited liquidity through money printing and simultaneously keep rates low just as the ECB and the Fed are doing currently.
But eventually the sheer weight of the debt will lead to Central Banks losing control of interest rates. Bond markets will then collapse and interest rates surge. It is only a question of how long this will take. It could be as short as one year or at the longest 3 years but when it happens, that would mean a systemic failure of the financial system.
A WORLD WITHOUT CENTRAL BANKS WOULD BE A BLESSING
The ECB starting QE of €20 billion per month for as long as it takes and reducing deposit rate from -0.4% to -0.5% is a clear sign of pressures in the European banking system. The Fed’s 0.25% rate reduction and overnight Repos of $75 billion or more as well as 14 day Repos of at least $30 billion indicate similar pressures in the US banking system.
In the next few years, Central Banks will lose total control of the financial system. But they have really never had control. They believe themselves that their actions are beneficial to the world economy when the real truth is that they are the root cause of all financial bubbles and collapses. If Central Banks didn’t exist, which would be a blessing, the world would not have these exaggerated cycles of mega booms and busts. Instead natural forces would regulate markets.
WITH NO CENTRAL BANKS THE SYSTEM WOULD BE SELF-REGULATING
If there was major demand for money, interest rates would naturally rise and make borrowings more expensive and thus regulate excessive credit growth. If there was little demand for credit, rates would come down and thus stimulate borrowings and growth. This sound natural system is very different to the situation today when we have an explosion of debt and negative interest rates, only made possible by massive Central Bank manipulation. This is a total anathema and completely defies all laws of nature as well as sound economic principles. That is why the current system will totally collapse as it doesn’t deserve to survive.
GOLD HAS OUTPERFORMED ALL ASSET CLASSES THIS CENTURY
I have since the beginning of this century warned investors of the risks in the financial system and the importance of protecting your wealth. I have also recommended physical gold as the best means of insuring your assets. As an investment, gold has outperformed all major asset classes this century. It hasn’t always been plain sailing. After the rise from $250 in 1999 to $1,920 in 2011, we have seen a correction and sideways move for 6 to 8 years depending on in which currency gold is measured.
Even during this long period of correction since 2011, I have never doubted that 2006-9 was just a rehearsal and that the real collapse of the world economy and the financial system was still to come. Nor have I been in any doubt that physical gold is the best method to preserve wealth against the risks. These risks have now increased exponentially as global debt has doubled from $125 trillion in 2006 to over $250 trillion today.
QUARTERLY GOLD CHARTS SHOW GOLD IS IN SECULAR BULL TREND
Yes, gold is in a secular bull market but a more accurate statement is that paper money is in a hopeless secular bear trend on their way to ZERO.
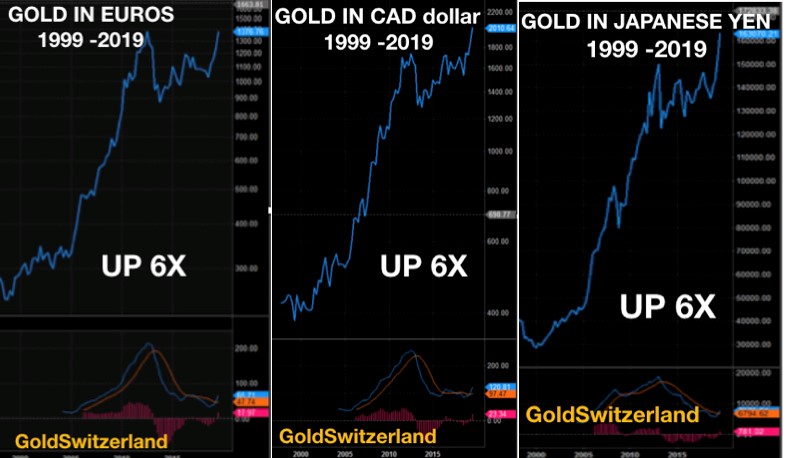
I have below included a number of quarterly charts in gold in various currencies. Even if you are not a chart expert, these charts clearly indicate that gold is in a major uptrend since 2000 and the sideways move between 2011 and 2019 is now finished. The next trend in the world economy is now starting with collapsing asset markets and gold surging.
The trigger in the gold market was the penetration of the 6 year resistance line at $1,350 – the Gold Maginot Line. So we have recently seen the first big up-move of gold for many years. This move is likely to accelerate imminently. So for anyone not protected, it is essential not to be left behind as gold and silver will soon move up very quickly.
Stocks and property markets are also likely to start a secular bear market now which will be devastating for the world. Although physical gold and some silver is vital financial protection, there will be many other risks that we must be prepared for including physical security due to criminality, social unrest, terrorist attacks, food shortages and much more. An important part of surviving these risks is a close group of family and friends. Helping others will be very important.
GOLD CHARTS
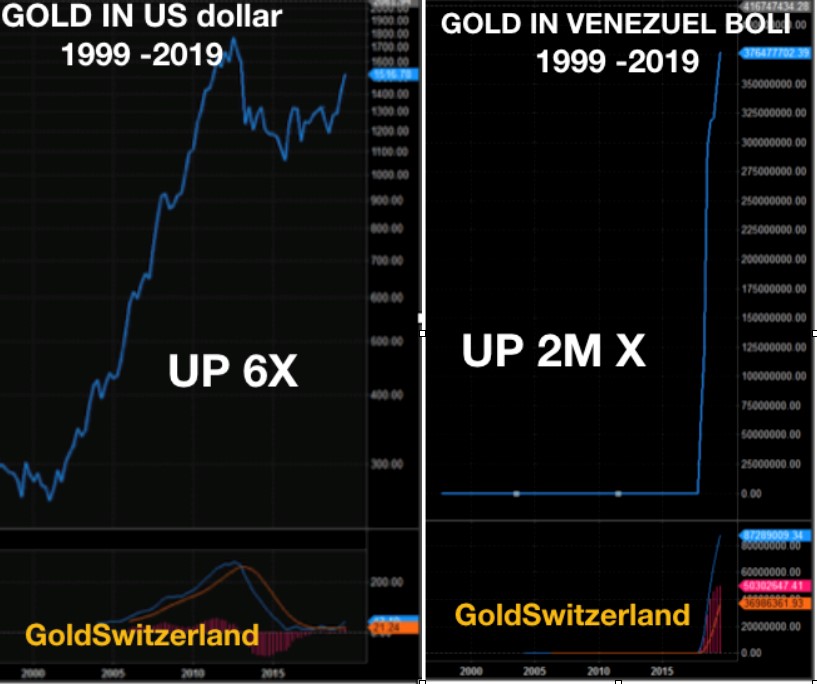
The quarterly charts below all indicate that gold has been in a strong uptrend since 2000 and is now starting an explosive move which will last for several years.
In all currencies but the US dollar gold has made new highs in 2019 and has moved up 5-7X since 1999. The last two charts show Gold in dollars and Venezuelan Bolivars. Gold in dollars is up 6X since 1999 and in Bolivars over 2 million times. Within the next 5-7 years, gold in US dollars could easily look like the Bolivar chart once hyperinflation takes hold.
Original source: Matterhorn - GoldSwitzerland
Reproduction, in whole or in part, is authorized as long as it includes all the text hyperlinks and a link back to the original source.
The information contained in this article is for information purposes only and does not constitute investment advice or a recommendation to buy or sell.


