Back in April 2011, just before gold exploded to a record above $1,900 following the US credit rating downgrade, we first said - and Kyle Bass echoed - that the main reason behind our long-running, bullish view on gold is that the Fed can't print gold, unlike every other asset.
Today, with a 9 year delay, Bank of America has caught up with where we were at the start of the decade, and repeating virtually everything we have said - consistently each day for over 11 years - says that while "the size of major central bank balance sheets has been stable at 21 to 28% of GDP in the past decade just like the gold price" things are changing rapidly and "as central banks & governments double their balance sheets & fiscal deficits we up our 18m gold target from $2000 to $3000/oz." And while it's not all smooth sailing, with the bank warning that "a strong USD backdrop, falling equity market volatility, and weak jewelry demand in India & China may remain headwinds", it is now clear that even Wall Street's agenda is aligned with that of all those who have been calling that the biggest beneficiary of central bank lunacy will be the "barbarous relic", one which according to the most clueless person of the 21st century only had value because it was "tradition." And yet here we are, when one of the biggest US banks just said that gold is the "ultimate store of value."
Who to believe: a pathological liar (i.e., a central banker) or someone who finally sees the light?
Incidentally, the name of the BofA report was "The Fed can't print gold", which was a delightful flashback to what we said some nine years ago.
Here are the key highlights from the report:
"Gold prices have performed well in the recent period
As the ultimate store of value, gold prices have performed well during the past 15 months, posting a rally of over 10% since the Federal Reserve did a monetary policy U-turn in January 2019. Gold has also delivered a strong performance against other asset classes YTD. Of course, it has not been a straight line up, and gold did sell off hard for a brief period in March. The swing in gold prices mirrored the down and then up move in real interest rates. Now our CTA models suggest gold positioning is light, likely because of the spike in volatility and the mechanical drop in the gold Sharpe ratio. But this constraint could change as volatility keeps falling quickly across financial markets.
Now, significant monetary, fiscal easing around the world…
Due to the Covid-19 lockdowns, US GDP could go down by 30% YoY in 2Q20, the steepest drop in modern history. Other countries like Japan will likely experience a 21.8% decline in output in 2Q20, while China just reported a contraction of 6.8% in 1Q20. As central banks rush to expand their balance sheets and backstop asset values and consumer prices, a lot of risks could end up being socialized. The size of major central bank balance sheets has been stable at around 25% of GDP for the last decade or so, just like the gold price. As economic output contracts sharply, fiscal outlays surge, and central bank balance sheets double, fiat currencies could come under pressure. And investors will aim for gold. Hence, we mark-to-market our forecasts and now project an average gold price of $1,695/oz in 2020 and $2,063/oz in 2021.
…lifts our 18m gold target from $2000/oz to $3000/oz
True, a strong USD backdrop, reduced financial market volatility, and lower jewelry demand in India and China could remain headwinds for gold. But beyond traditional gold supply and demand fundamentals, financial repression is back on an extraordinary scale. Rates in the US and most G-10 economies will likely be at or below zero for a very long period of time as central banks attempt to push inflation back above their targets. Beyond real rates, variables such as nominal GDP, central bank balance sheets, or official gold reserves will remain the key determinants of gold prices, in our view. As central banks and governments double their balance sheets and fiscal deficits respectively, we have also decided to up our 18m gold target from $2,000 to $3,000/oz."
And with that let's dig deeper into "The Fed can't print gold" and why BofA thinks that gold will have a 3-handle in 18 months time:
Gold prices have performed well during the recent period…
As the ultimate store of value, gold prices have performed well during the past 15 months, posting a rally of 12% since the Federal Reserve did a monetary policy U-turn in January 2019 (Chart 1). More recently, gold prices have continued to post a robust run, with returns broadly outpacing other major asset classes year-to-date (Chart 2). Only long duration bonds and high quality tech stocks have delivered comparable performance, with 30 year Treasury yields posting 16.9% and the S&P Tech Sector delivering flat returns YTD.
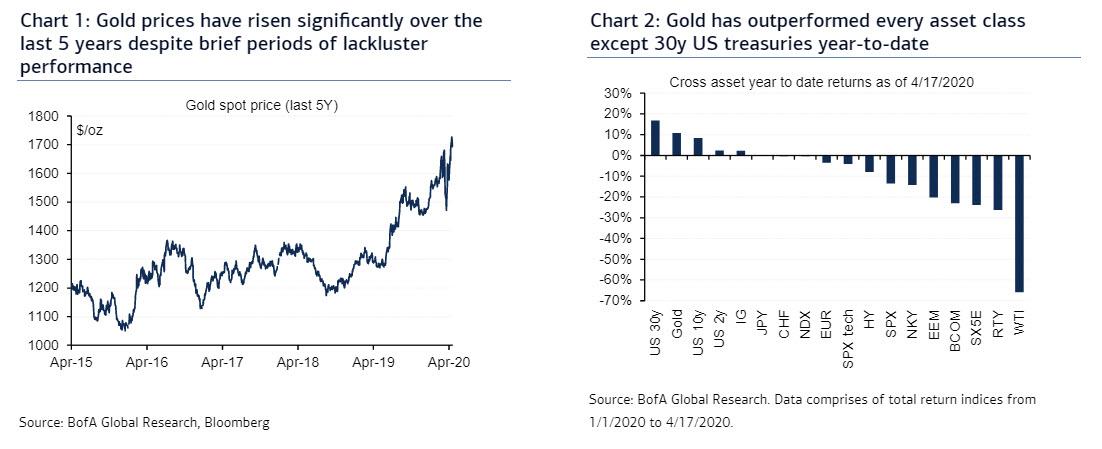
…except over a brief window where liquidation occurred
Of course, it has not been a straight line up for the yellow metal. In fact, gold prices sold off very hard with close to 5 million futures trading volume during the March 9th to March 19th window (Chart 3) on the back of a major liquidity crunch. The move was not unique to the gold market, with fixed income assets also experiencing a big spike in volatility around that time (Chart 4). The pre-March 19 peak to trough decline for gold was 12% compared to an 8% drop in the US Treasury Inflation Protected Securities (TIPS) ETF or a 22% decline in investment grade ETF values such as LQD.
![]()
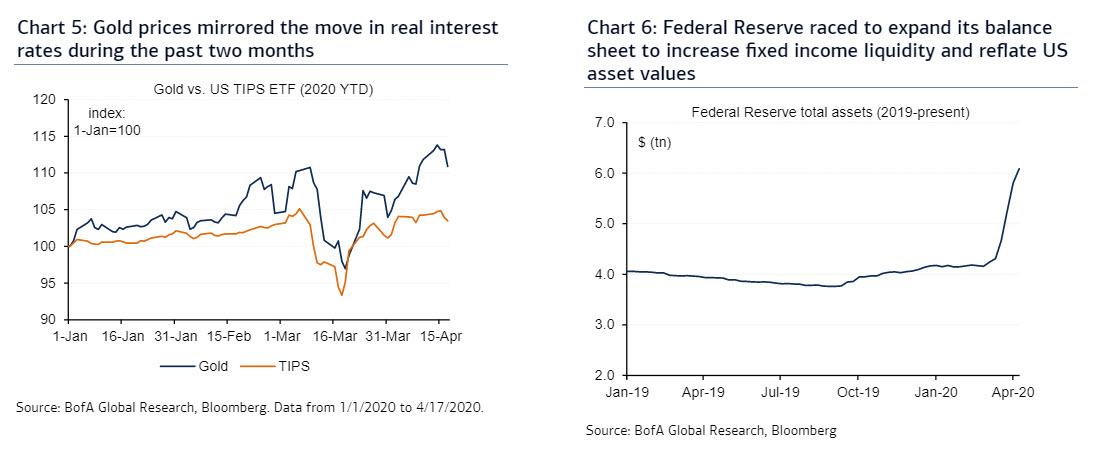
The sell-off in gold prices mirrored the move in real rates
It is worth noting too that the drop in gold prices mirrored the move in real interest rates during the past two months (Chart 5). As investors feared the extension of the China lockdown to the US and the rest of the world economy, asset values and consumer price expectations collapsed faster than nominal interest rates, triggering fears of an economic depression. Having learned the lessons of the Global Financial Crisis (GFC), the Federal Reserve raced to expand its balance sheet to increase fixed income liquidity and reflate US asset values, ultimately supporting a sharp recovery in gold prices (Chart 6).
Gold is a function on real rates, USD, commodities and risk…
As explained above, the selloff and subsequent recovery in gold prices during March was somewhat mechanical in nature. As the ultimate store of value, gold is a reflection of market movements across all major financial and physical assets. In the past we have argued that gold volatility is a function of real interest rates, USD, commodities and risk (Chart 7). Swings in these four variables alone can help explain up to 80% of variation in weekly gold price changes (Chart 8), providing an important template to understand the direction of future gold prices.

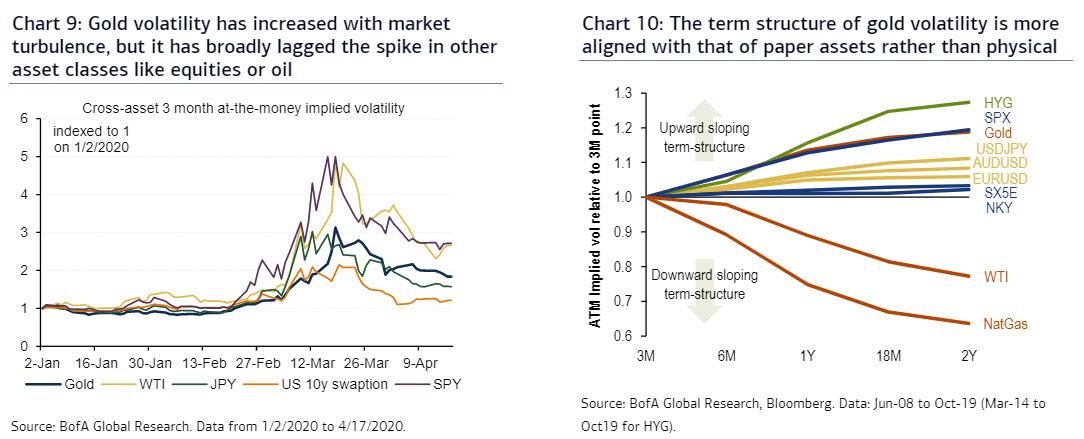
…and gold volatility tends to follow moves in other markets
Another factor to think about in precious metals is volatility. Specifically, gold volatility increased with market turbulence, but it has broadly lagged the spike in other asset classes like equities or oil (Chart 9). On our estimates, gold volatility more or less tracked G10 currency vol in the past two months, particularly mirroring perceived safe haven currencies like JPY and CHF. Unlike other commodity markets, the term structure of gold volatility is more aligned with that of paper assets (Chart 10). In contrast to oil or natural gas, gold is not constrained by storage dynamics and its price is not necessarily mean-reverting to the marginal cost of production over the long run.
Original source: Zero Hedge
Reproduction, in whole or in part, is authorized as long as it includes all the text hyperlinks and a link back to the original source.
The information contained in this article is for information purposes only and does not constitute investment advice or a recommendation to buy or sell.


