As lawmakers around the world congratulate themselves on taming this year, the charts of Oil, Copper and Gold suggest the biggest inflation is ahead of us.
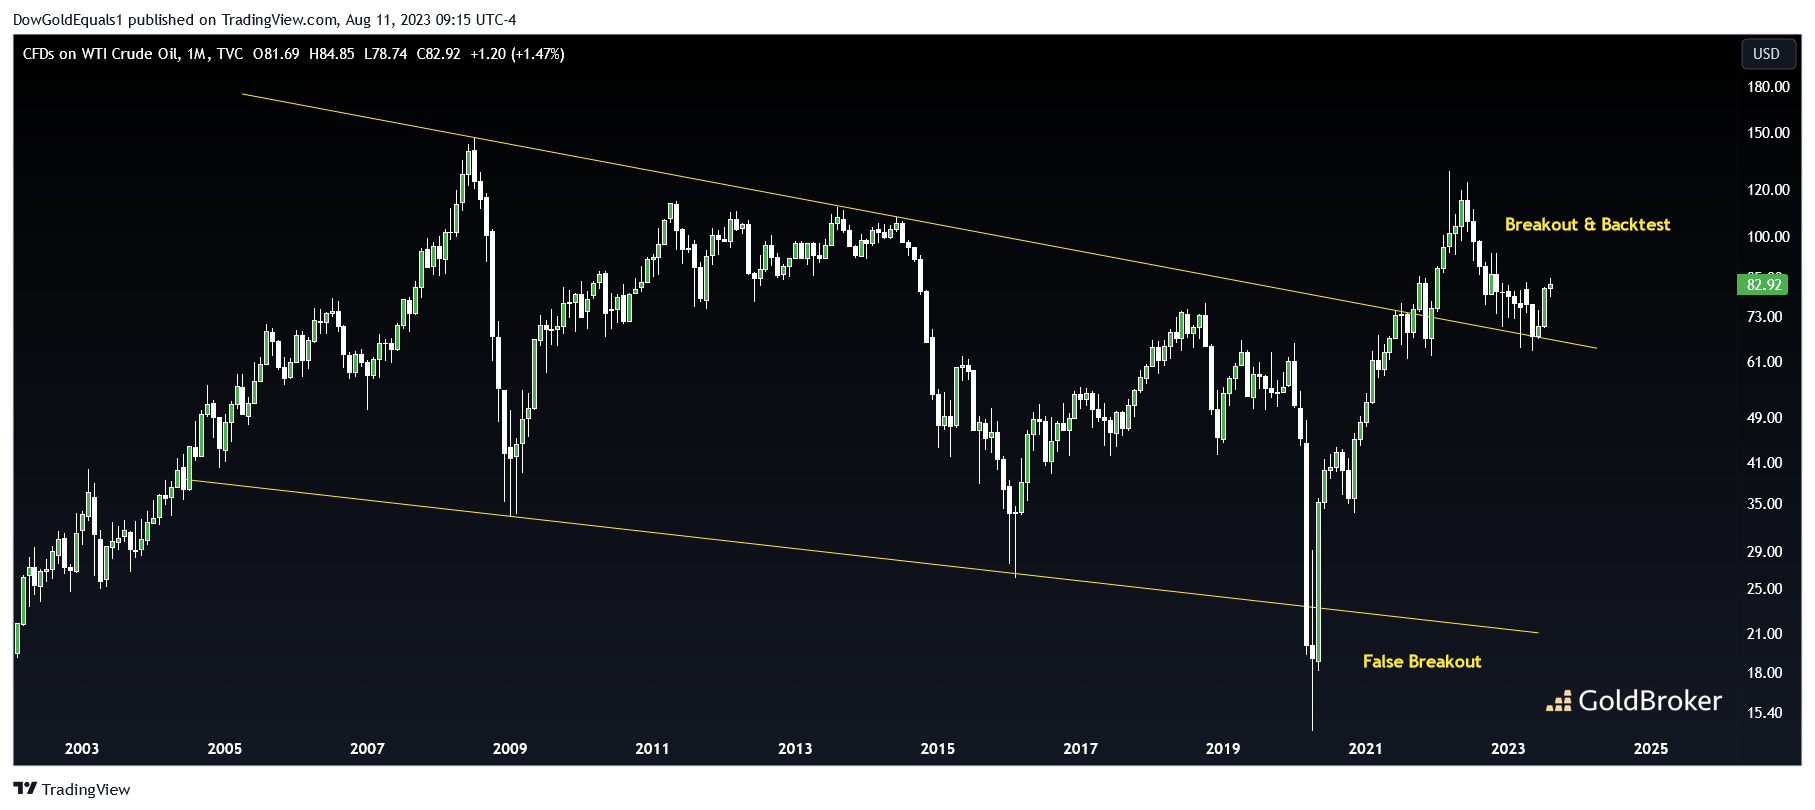
The chart of Oil might be the most obvious tell as it has formed a massive, yet classic, 20-year bullish falling wedge. Note how the huge false breakout in 2020 created a springboard to launch price out of the wedge, which has since successfully backtested and now looks poised for a continuation move to much higher prices.
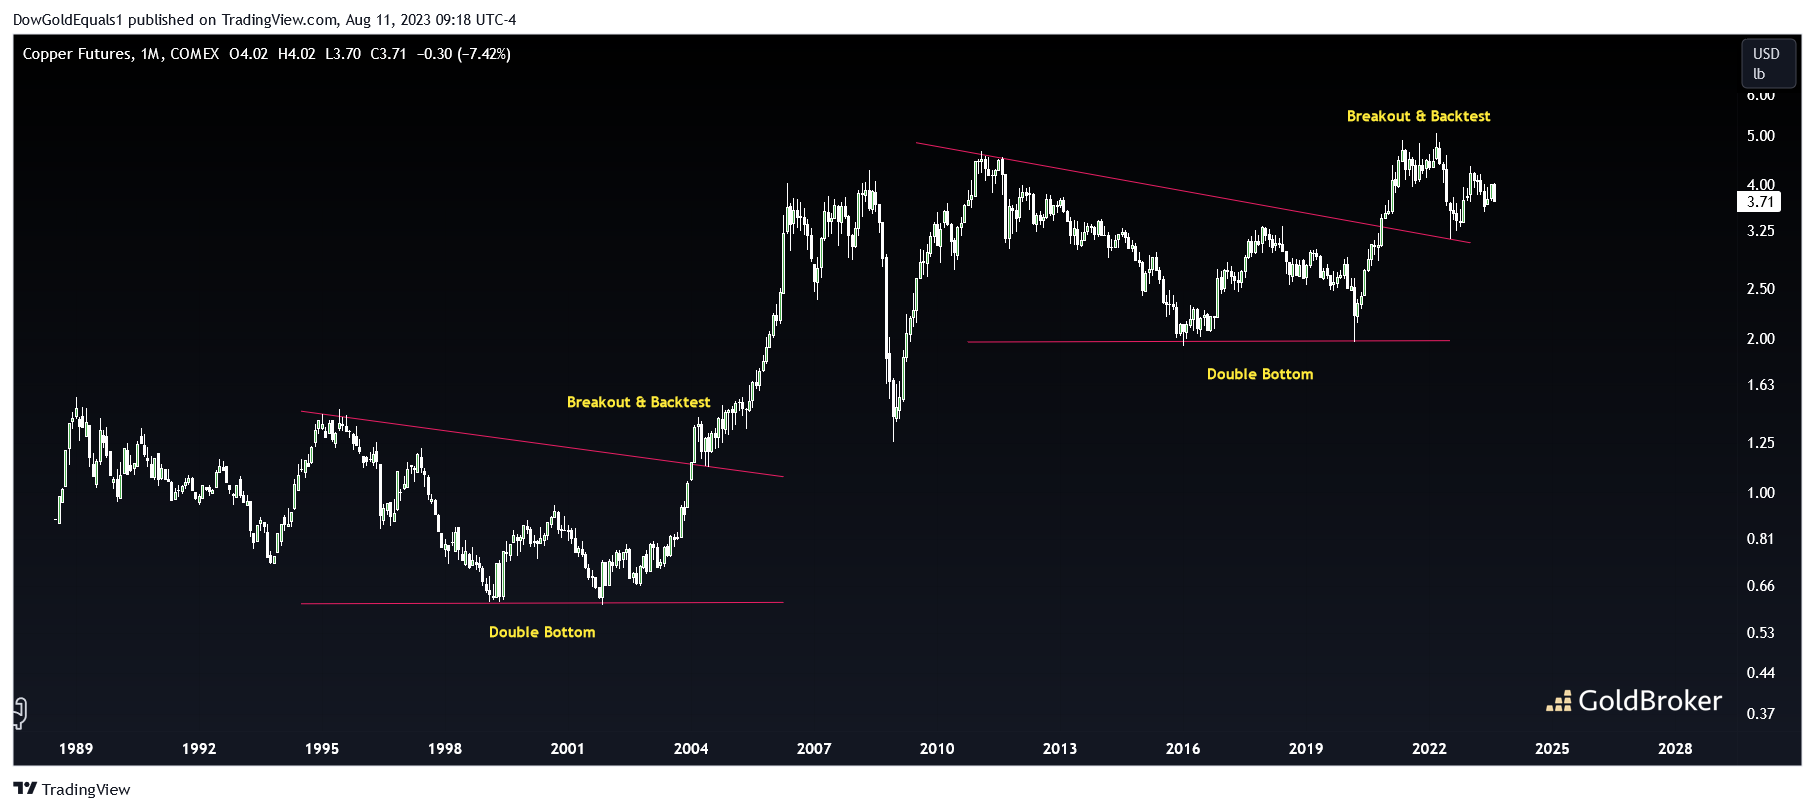
Copper's chart is a bit more nuanced but it is fascinating. Note how its current decade-long bullish wedge, complete with a double-bottom, is a near replica fractal of the wedge formed between 1994-2004. While the breakout and backtest is more pronounced this time around, the set-up is similar to 2004 when an impulse move higher following the backtest led to a 4X move in price in just 3 years. The set-up is certainly there to see $10+ copper this decade!
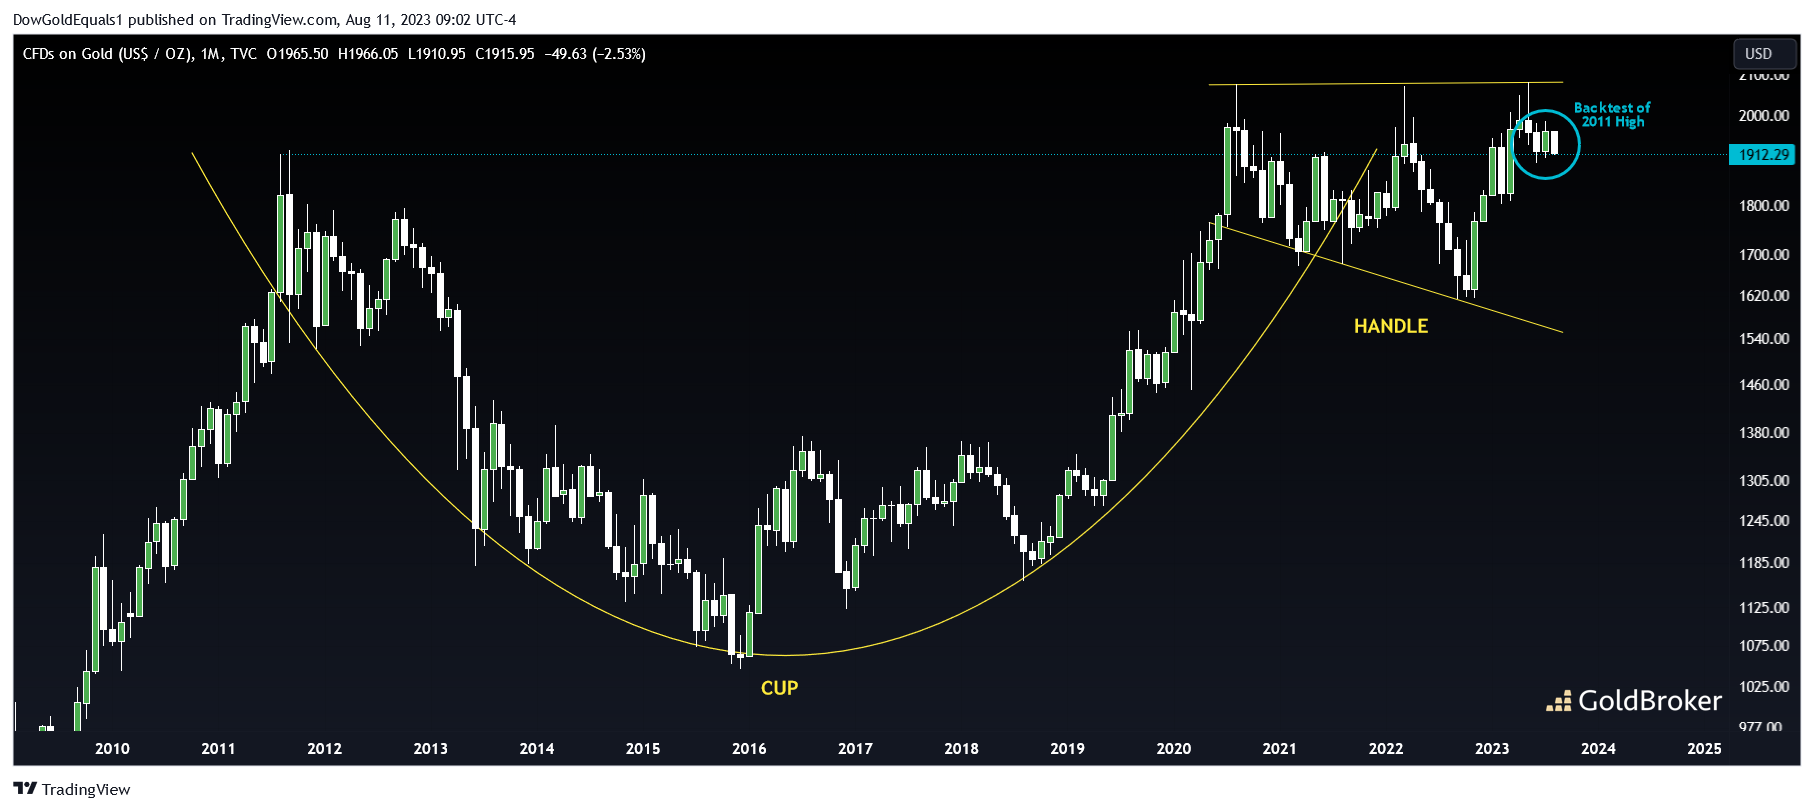
Checking in on Gold, there is no doubt some frustration that price has declined from around $2,080 in May to around $1915 at the time of this writing. However, the chart shows us that not only does its 12-year Cup & Handle remain perfectly intact, but that the last three months of trading action may represent a very healthy backtest of 2011 highs. If price can hold above the $1900 area and ideally close the month above $1915, this successful backtest may serve as a launch pad that allows Gold to follow Oil and Copper prices higher.
Given the very compelling set-ups in these highly inflation-sensitive commodities, it appears very early to be calling victory over inflation, indeed!
Reproduction, in whole or in part, is authorized as long as it includes all the text hyperlinks and a link back to the original source.
The information contained in this article is for information purposes only and does not constitute investment advice or a recommendation to buy or sell.


