Gold investors feel like they have been on a rollercoaster this month, as price has ranged from as low as $1,810 to as high as $1,932. Sometimes, a pick up in volatility means that a big move lies ahead. Most often, an increase in volatility is a wise opportunity to take a step back and look at the bigger picture and see where gold price is most likely headed - and that's what we'll do this week.
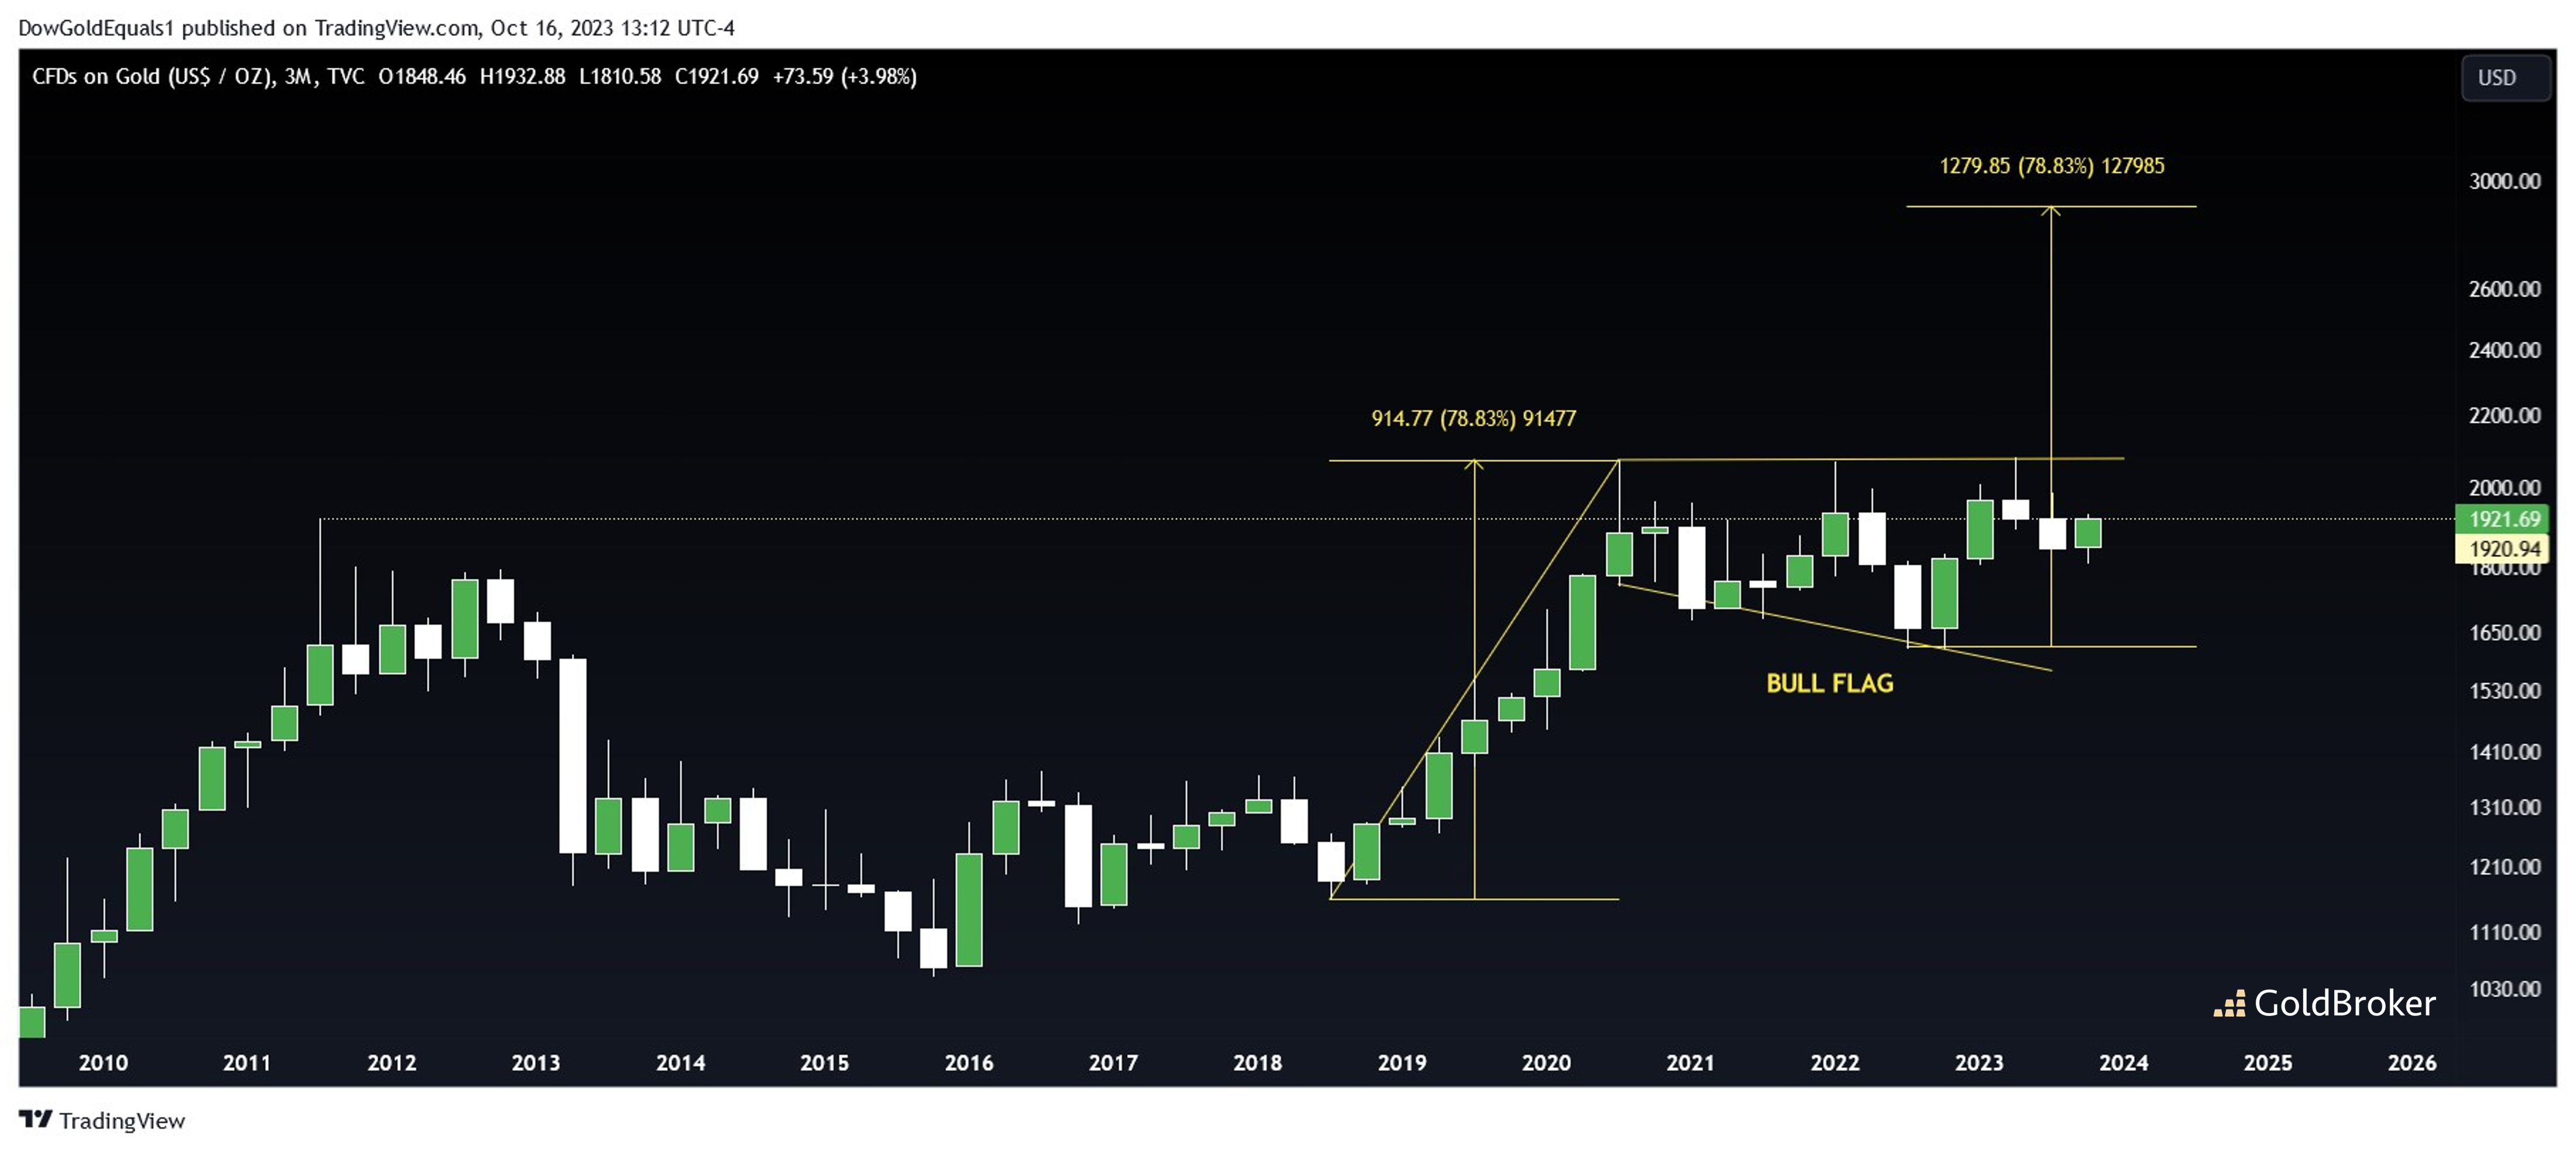
Starting with a quarterly chart going back to 2010, we can see that price has spent the last 14 quarters forming a massive bull flag right on top of the historic high set in 2011. When price consolidates just below/above an important trendline or price point, it often means an impulsive resolution will follow when it finally breaks out. In this case, the bull flag measured move is to around $2,900!
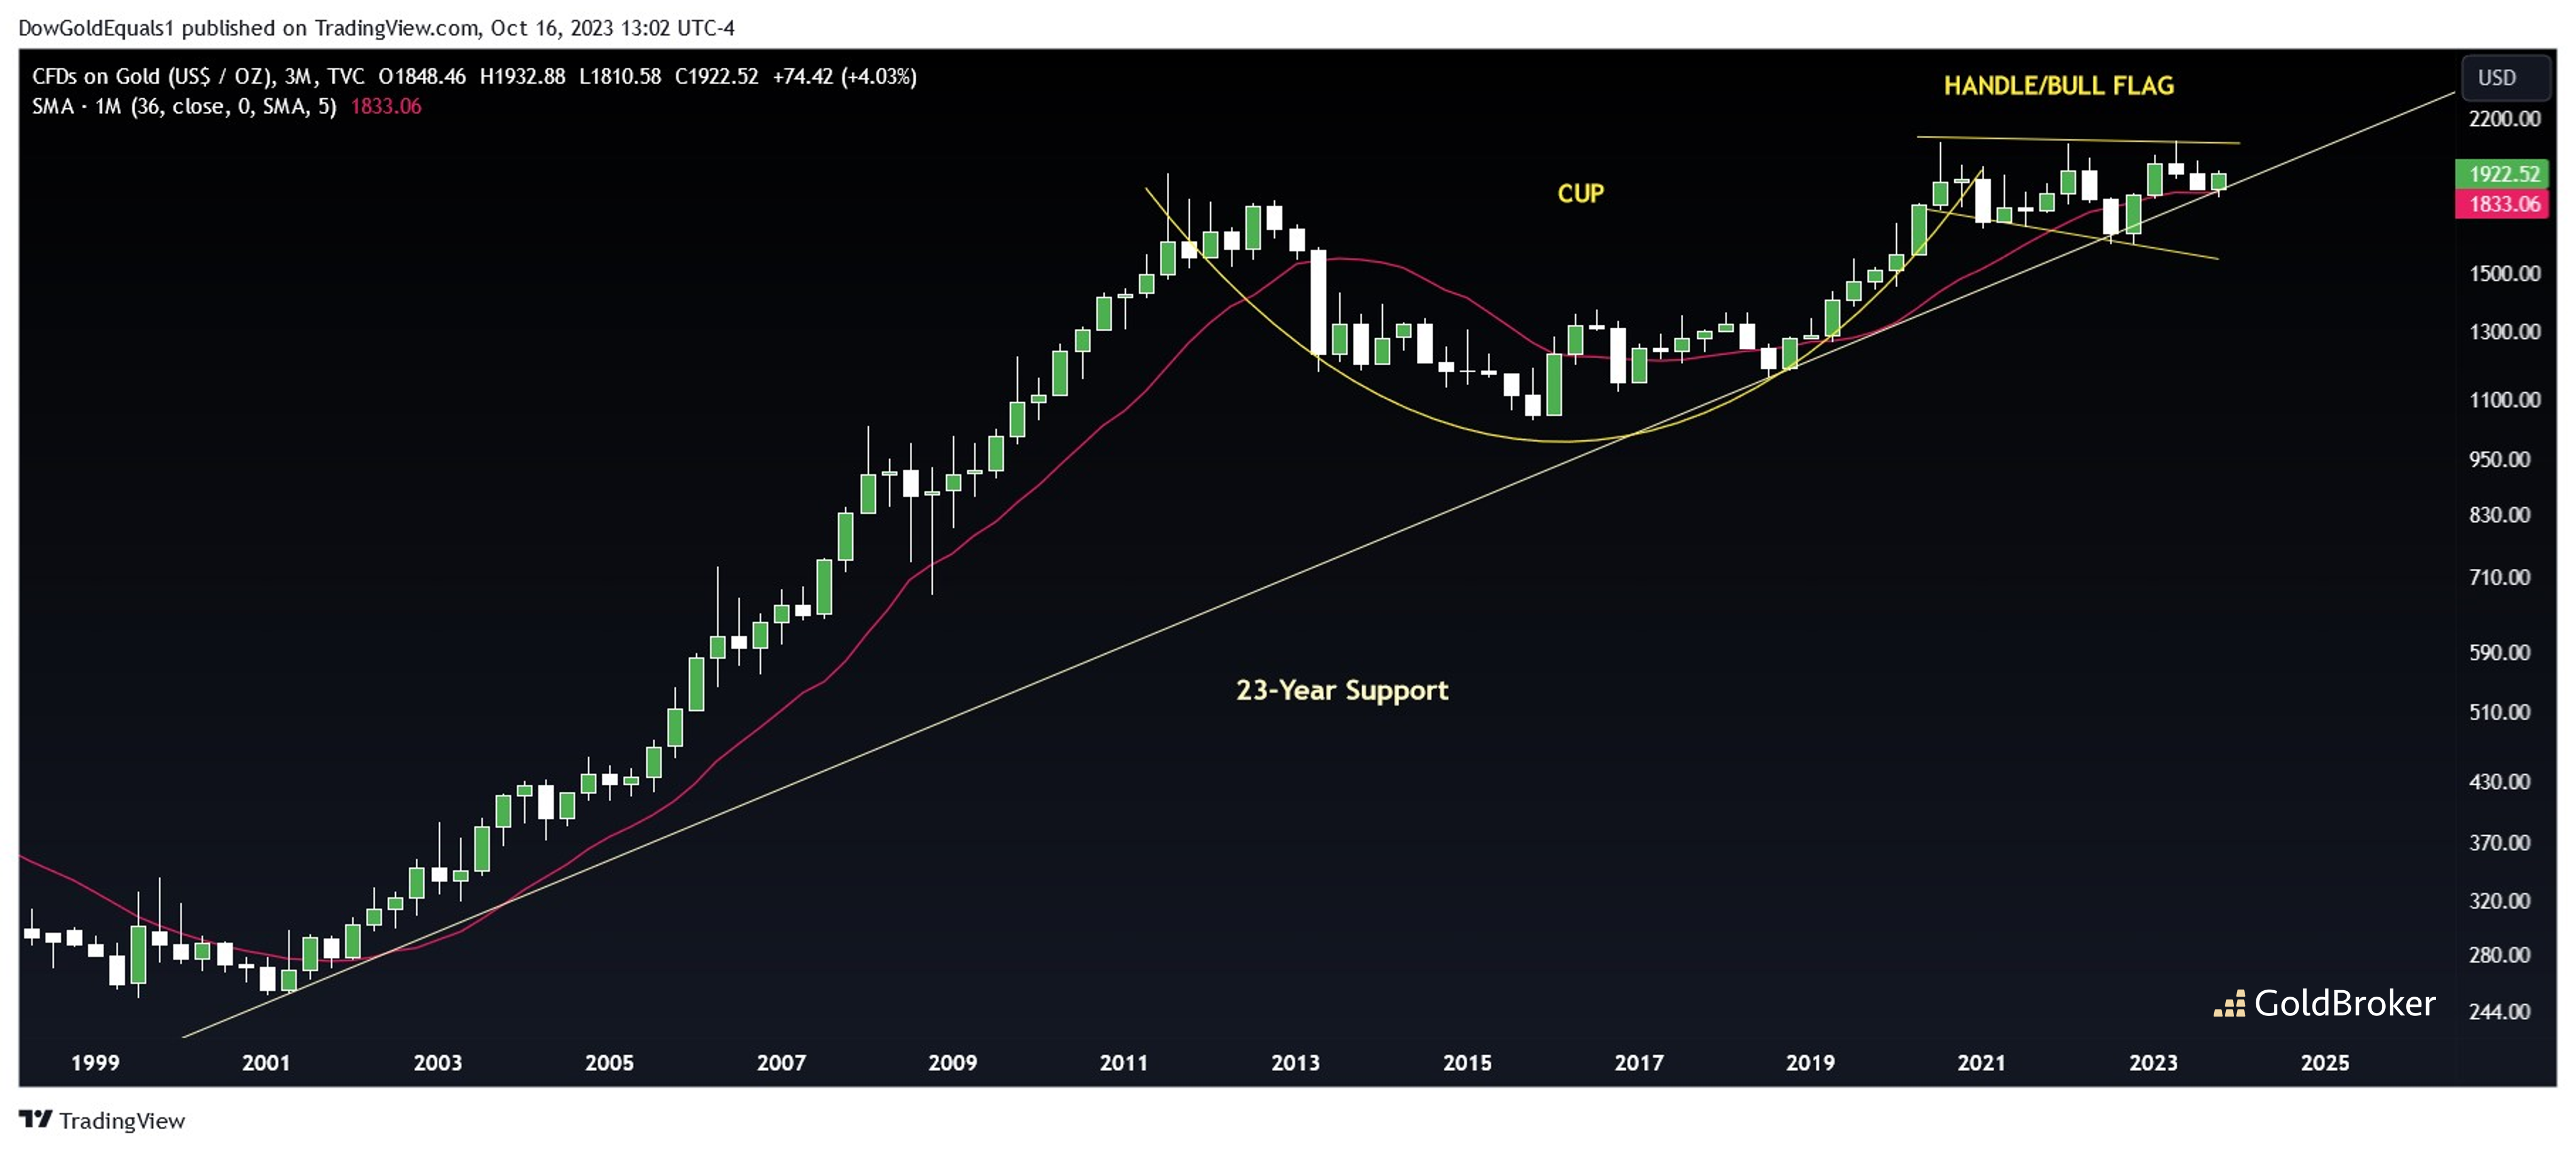
Zooming the quarterly chart out to Gold's historic bottom in 2001, we can see a number of positives for the yellow metal. In addition to a massive Cup & Handle pattern that remains perfectly intact, we can see that despite the volatility in price this month Gold has not violated its near 23-year support line. Also of note is that Gold has stayed above its 36-month moving average, something price always has done when it is in a sustained uptrend. Should its historic support line and the 36-month moving average continue to provide support, Gold may be breaking out of its Cup & Handle sooner than later, and that would make $3,000 and beyond quite achievable over the next couple of years.
Reproduction, in whole or in part, is authorized as long as it includes all the text hyperlinks and a link back to the original source.
The information contained in this article is for information purposes only and does not constitute investment advice or a recommendation to buy or sell.


