It has been a while since we have looked at Silver/Euro, but given the breakout we are seeing this month, this is one we want to revisit. While the title of this article may sound hyperbolic, a review of the following charts will demonstrate it is quite reasonable to conclude that Silver/Euro is on the cusp of big moves ahead.
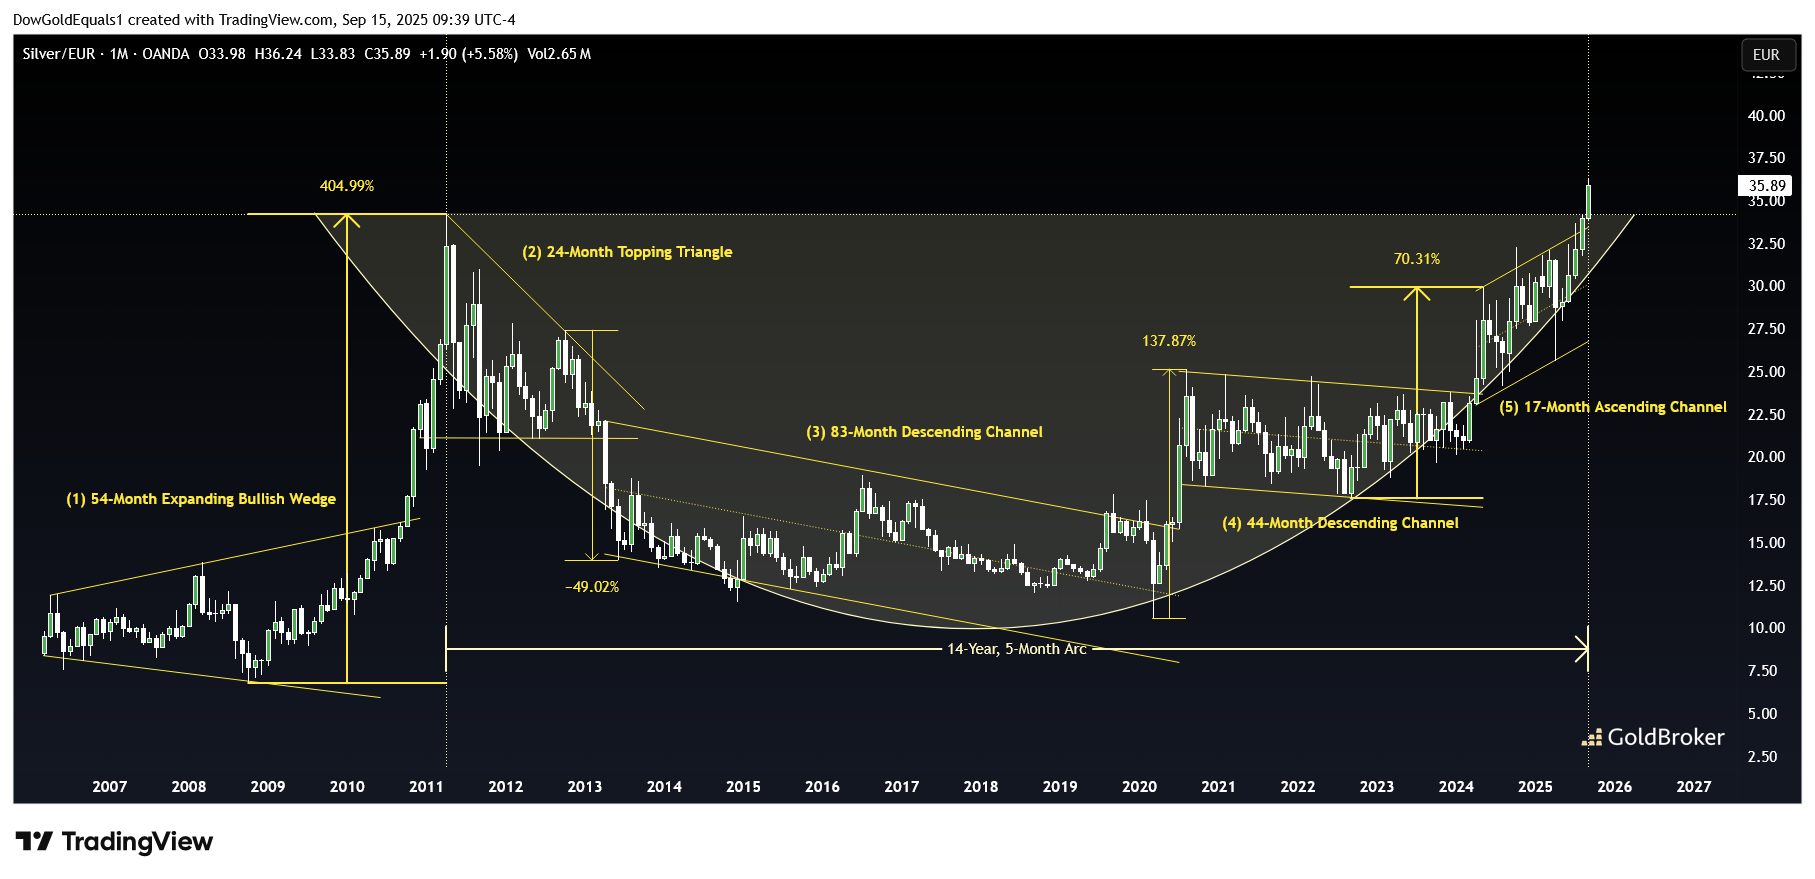
We will start with a 20-year monthly chart of Silver/Euro. The chart is a busy one, so we will go through it step-by-step. When you understand Silver/Euro's natural trading behavior, the potential ahead becomes self-evident. I have defined the chart as a series of consolidation patterns, followed by breakouts. The first consolidation was a 54-month expanding bullish wedge that began in 2006 and ultimately resolved in an historic 400% total move that signaled an important top in Silver/Euro's secular bull market. Technical Analysis tells us that, the larger the move, the longer the following consolidation will be required to digest those gains. That is exactly what we got beginning in 2011, as Silver/Euro descended into what has now been a 14.5-year arc that, within it, contains four consolidation patterns.
The first consolidation pattern within the arc was a 2-year flat-bottomed topping triangle. In real time, there was no way to know this pattern was a top until the triangle gave way in 2013 around €21. As if this pain wasn't enough, investors were then treated to a near 7-year descending channel bottoming pattern that saw Silver/Euro ultimately cut in half yet again, culminating around €10 in 2020. A 138% move higher over just six months finally launched price out of its cyclical bear market during what were known then as the "Silver Squeeze" days. Such a large move required yet another large consolidation, and investors were then forced to deal with a near 4-year descending channel that then broke out and into our most recent 17-month ascending channel.
To review, Technical Analysis teaches us the following:
- Price is either in an impulse (moving quickly over a short time period), consolidating or topping/bottoming
- Impulse moves require time to consolidate gains/losses: The greater the impulse, the more time is required to consolidate that price action
- Consolidations build energy for the next move: The greater the consolidation, the more violent the resulting impulse can be expected
- Price charts often respect symmetry: The strength of an impulse move into a consolidation pattern is quite often mirrored by the impulse out of a consolidation pattern
This brings us back to the chart. In the big picture, we see that a 400% move from 2008-2011 sent price into a 14.5 year arc, from which we have now just emerged this month. Quite simply, given the magnitude of the impulse into the arc, the arc's duration and painful consolidations within it, we can now expect a similar impulse move out of the arc in the order of hundreds of percent over the next several years.
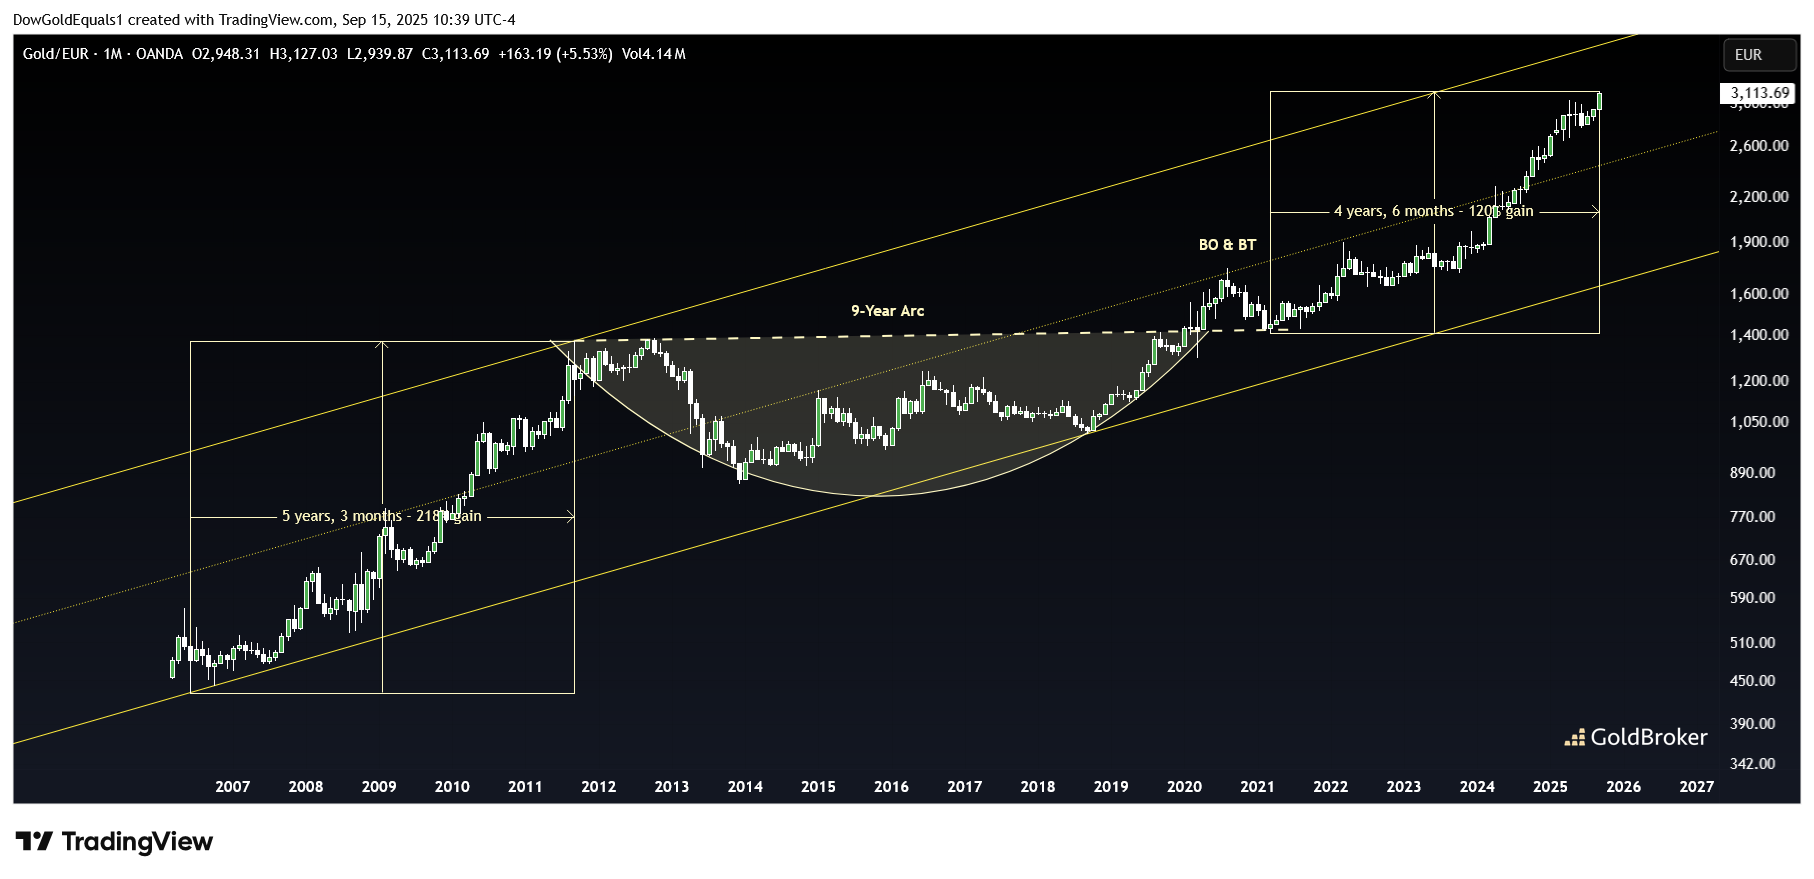
A nice example of these charting fundamentals comes directly from Gold/Euro, which I have defined as a 20-year ascending channel. Within it, we see a strong 218% impulse move higher, followed by a 9-year arc. Following a perfect breakout and backtest of the arc, price then began a symmetrical impulse move higher, which currently stands at 120% over 4.5 years and is likely not done yet.
Given what we see here, a 2X-4X move in Silver/Euro over the next several years should surprise no one.
Reproduction, in whole or in part, is authorized as long as it includes all the text hyperlinks and a link back to the original source.
The information contained in this article is for information purposes only and does not constitute investment advice or a recommendation to buy or sell.


