It's been a while since we've looked at gold and silver measured in World Currency Units (WCU), but I like to go back to these charts from time to time. For the metals to be in bona fide bull markets, you want to see them outperform all major currencies instead of solely dollars or euros, for example, and these charts help you see through the noise you can sometimes get when pricing in a single major currency.
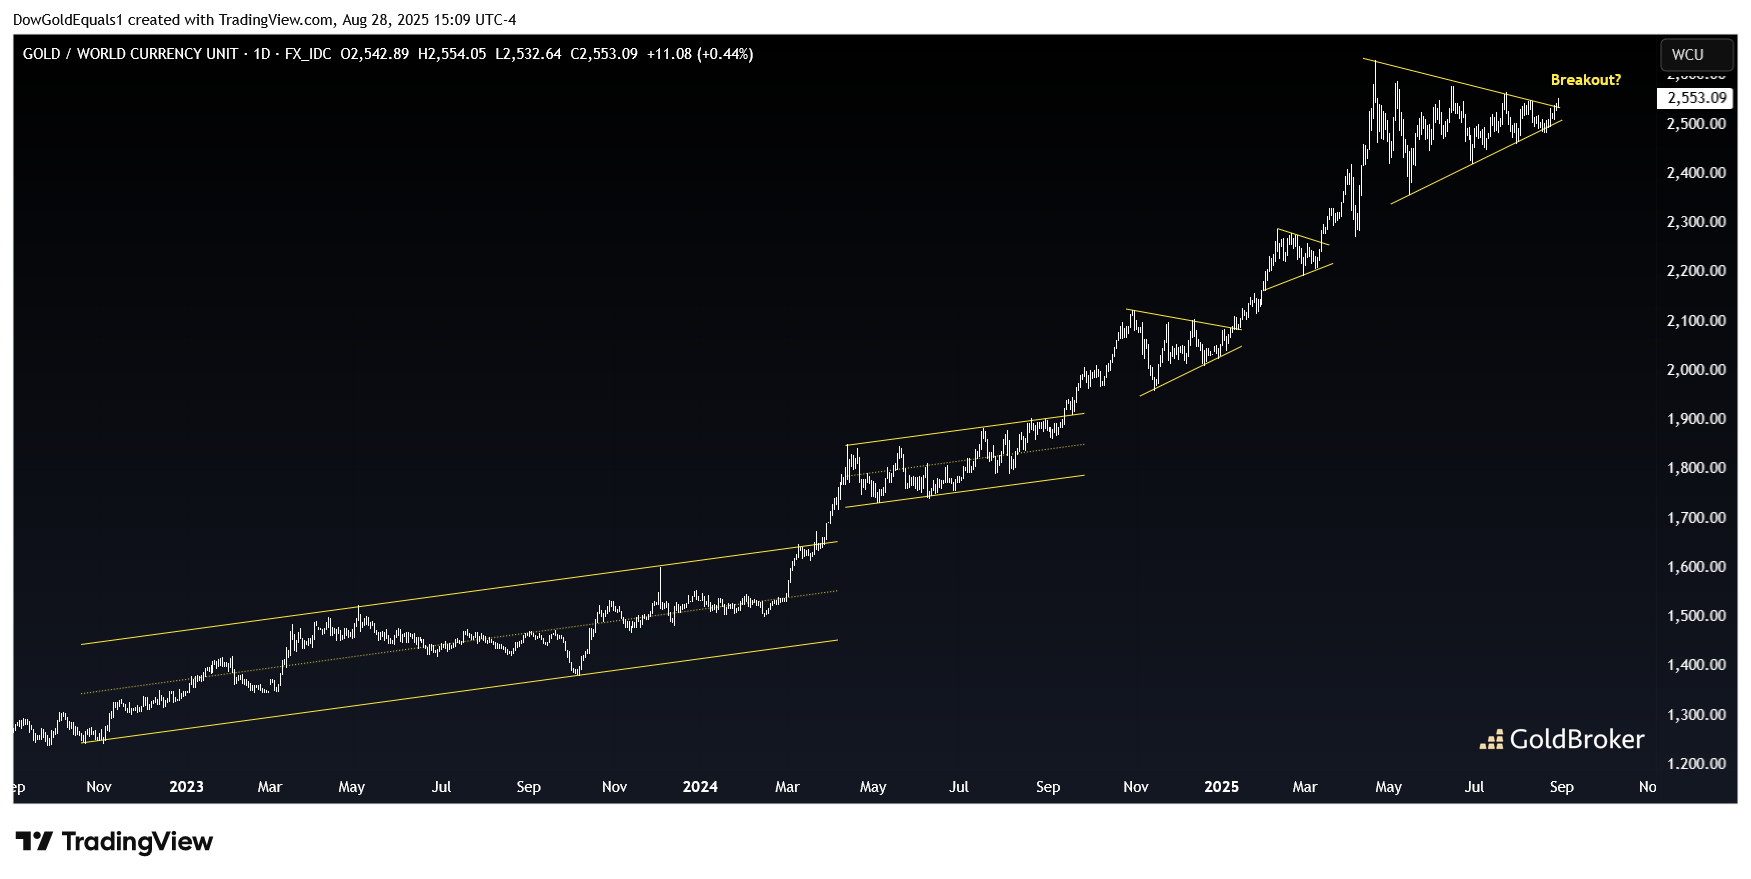
Starting with Gold/WCU we can see it has put in a healthy series of consolidations followed by impulse moves higher over the past few years. The current multi-month bull pennant has been frustrating for traders, as gold has not put in a new dollar high since April, but you can see here in the broader context that this consolidation is evidence of conventional, healthy bull market action. If you look closely at the current pennant, you'll even see that price has started to break out – something not as obvious currently when looking at the gold price in dollars.
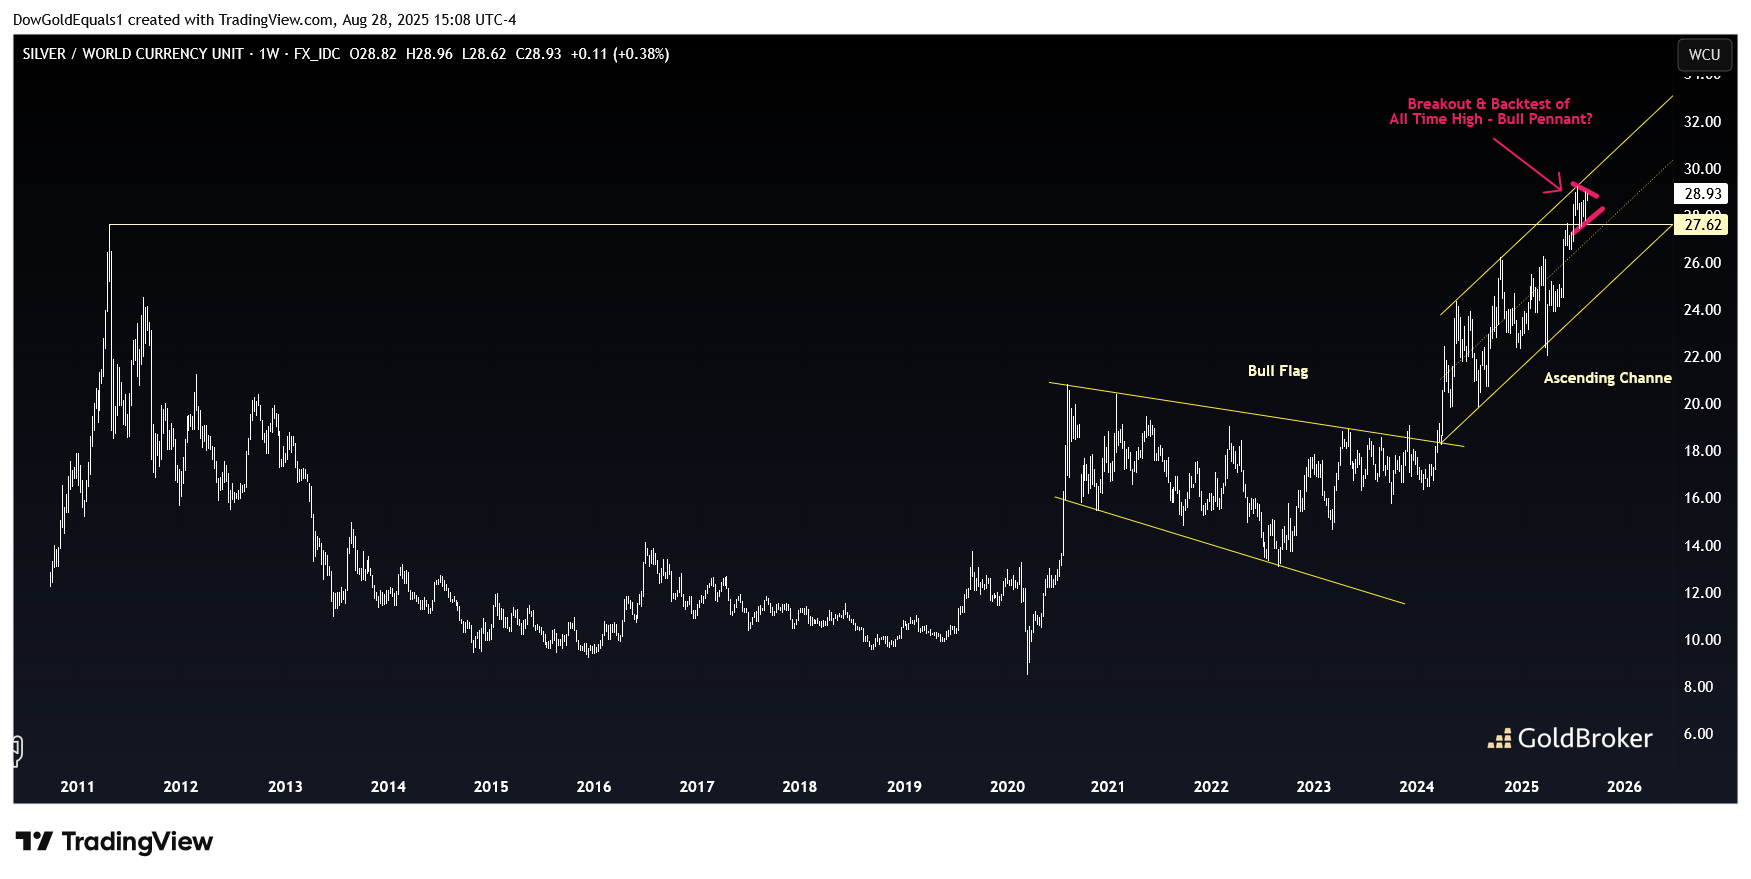
The chart of Silver/WCU is even more compelling, as we see how the large bull flag that formed coming out of COVID propelled price into an ascending channel and a break above its 2011 all time high. Price has since backtested the 2011 high and looks to be forming a small pink flag above it - yet more healthy bull market action. A further breakout from this small pink flag could see silver launch much higher and potentially threaten its 2011 dollar value high.
Based on these charts, I expect that the last few months of consolidation will soon be rewarded by higher metals prices this fall.
Reproduction, in whole or in part, is authorized as long as it includes all the text hyperlinks and a link back to the original source.
The information contained in this article is for information purposes only and does not constitute investment advice or a recommendation to buy or sell.


