A quarterly line chart often helps eliminate short-term trading noise and makes it easier to see major trends, consolidations and turning points. If you follow these charts closely, you can use them as an early warning system to spot significant breakouts before they show up on weekly or monthly charts. This is particularly relevant to the Silver and Silver/Euro charts today.
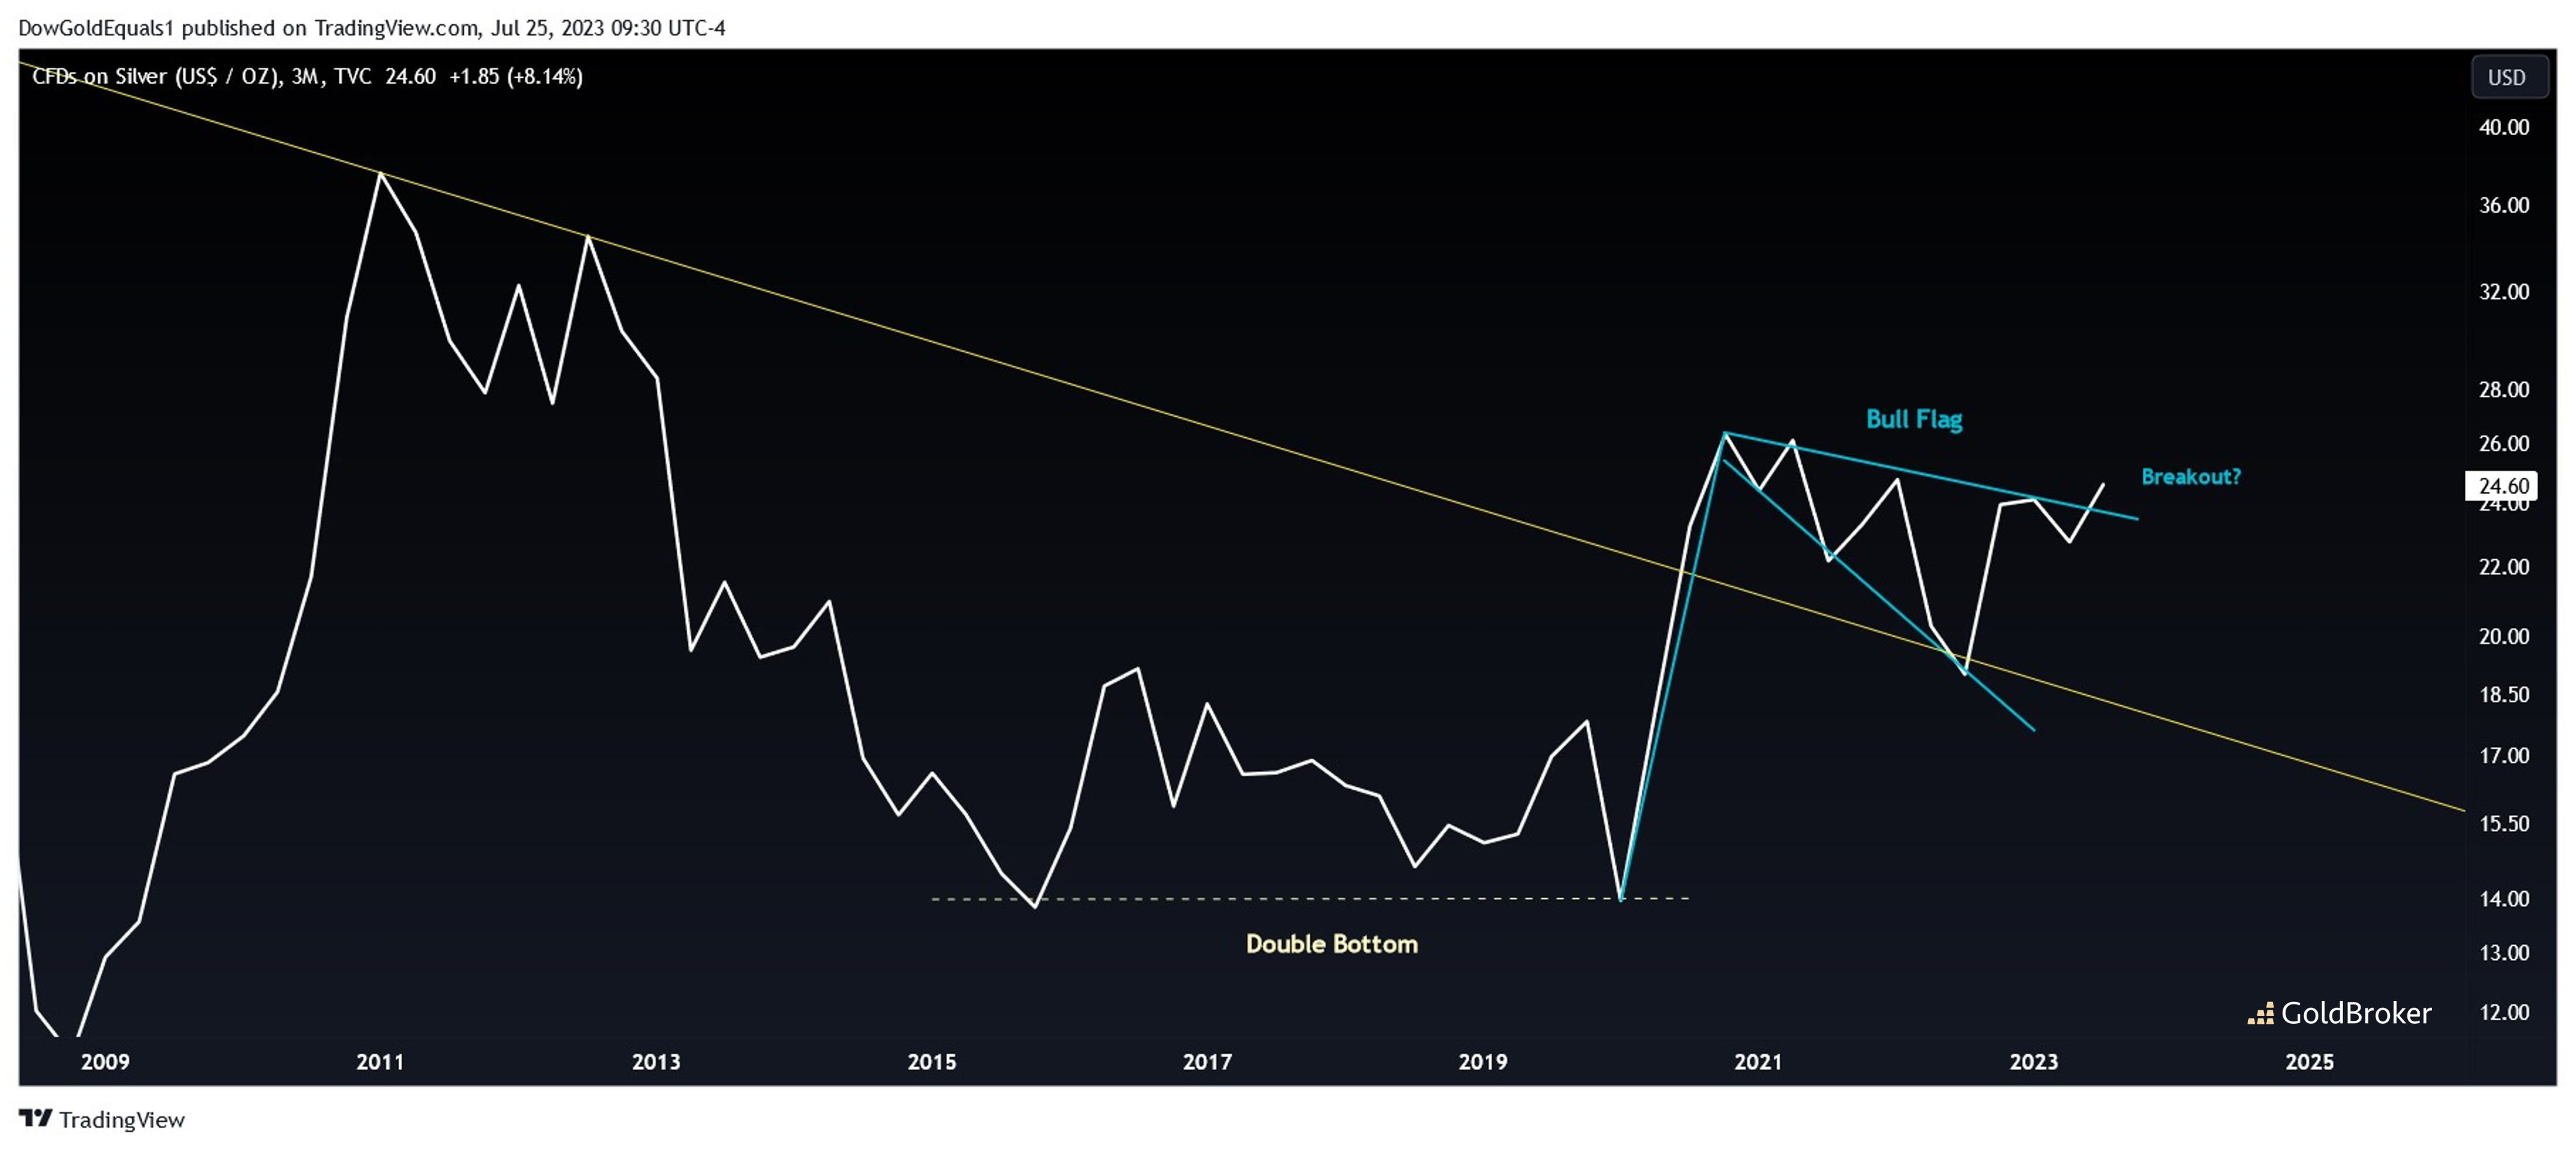
Looking at the Silver quarterly line chart, the first signal that a major bull move was set to commence came in Q1, 2020 when its quarterly closing price held at $13.97 and set up a major double bottom with its Q4, 2015 closing price of $13.84. The impulse move higher off the 2020 low carried price through the major resistance of the yellow declining trendline, which was followed by consolidation into the blue bull flag - extremely encouraging bull market action. Price has been consolidating within the bull flag for nearly three years, but we can see it finally breaking out just this quarter. If this breakout holds, we have a very important signal that the next major bull leg has begun.
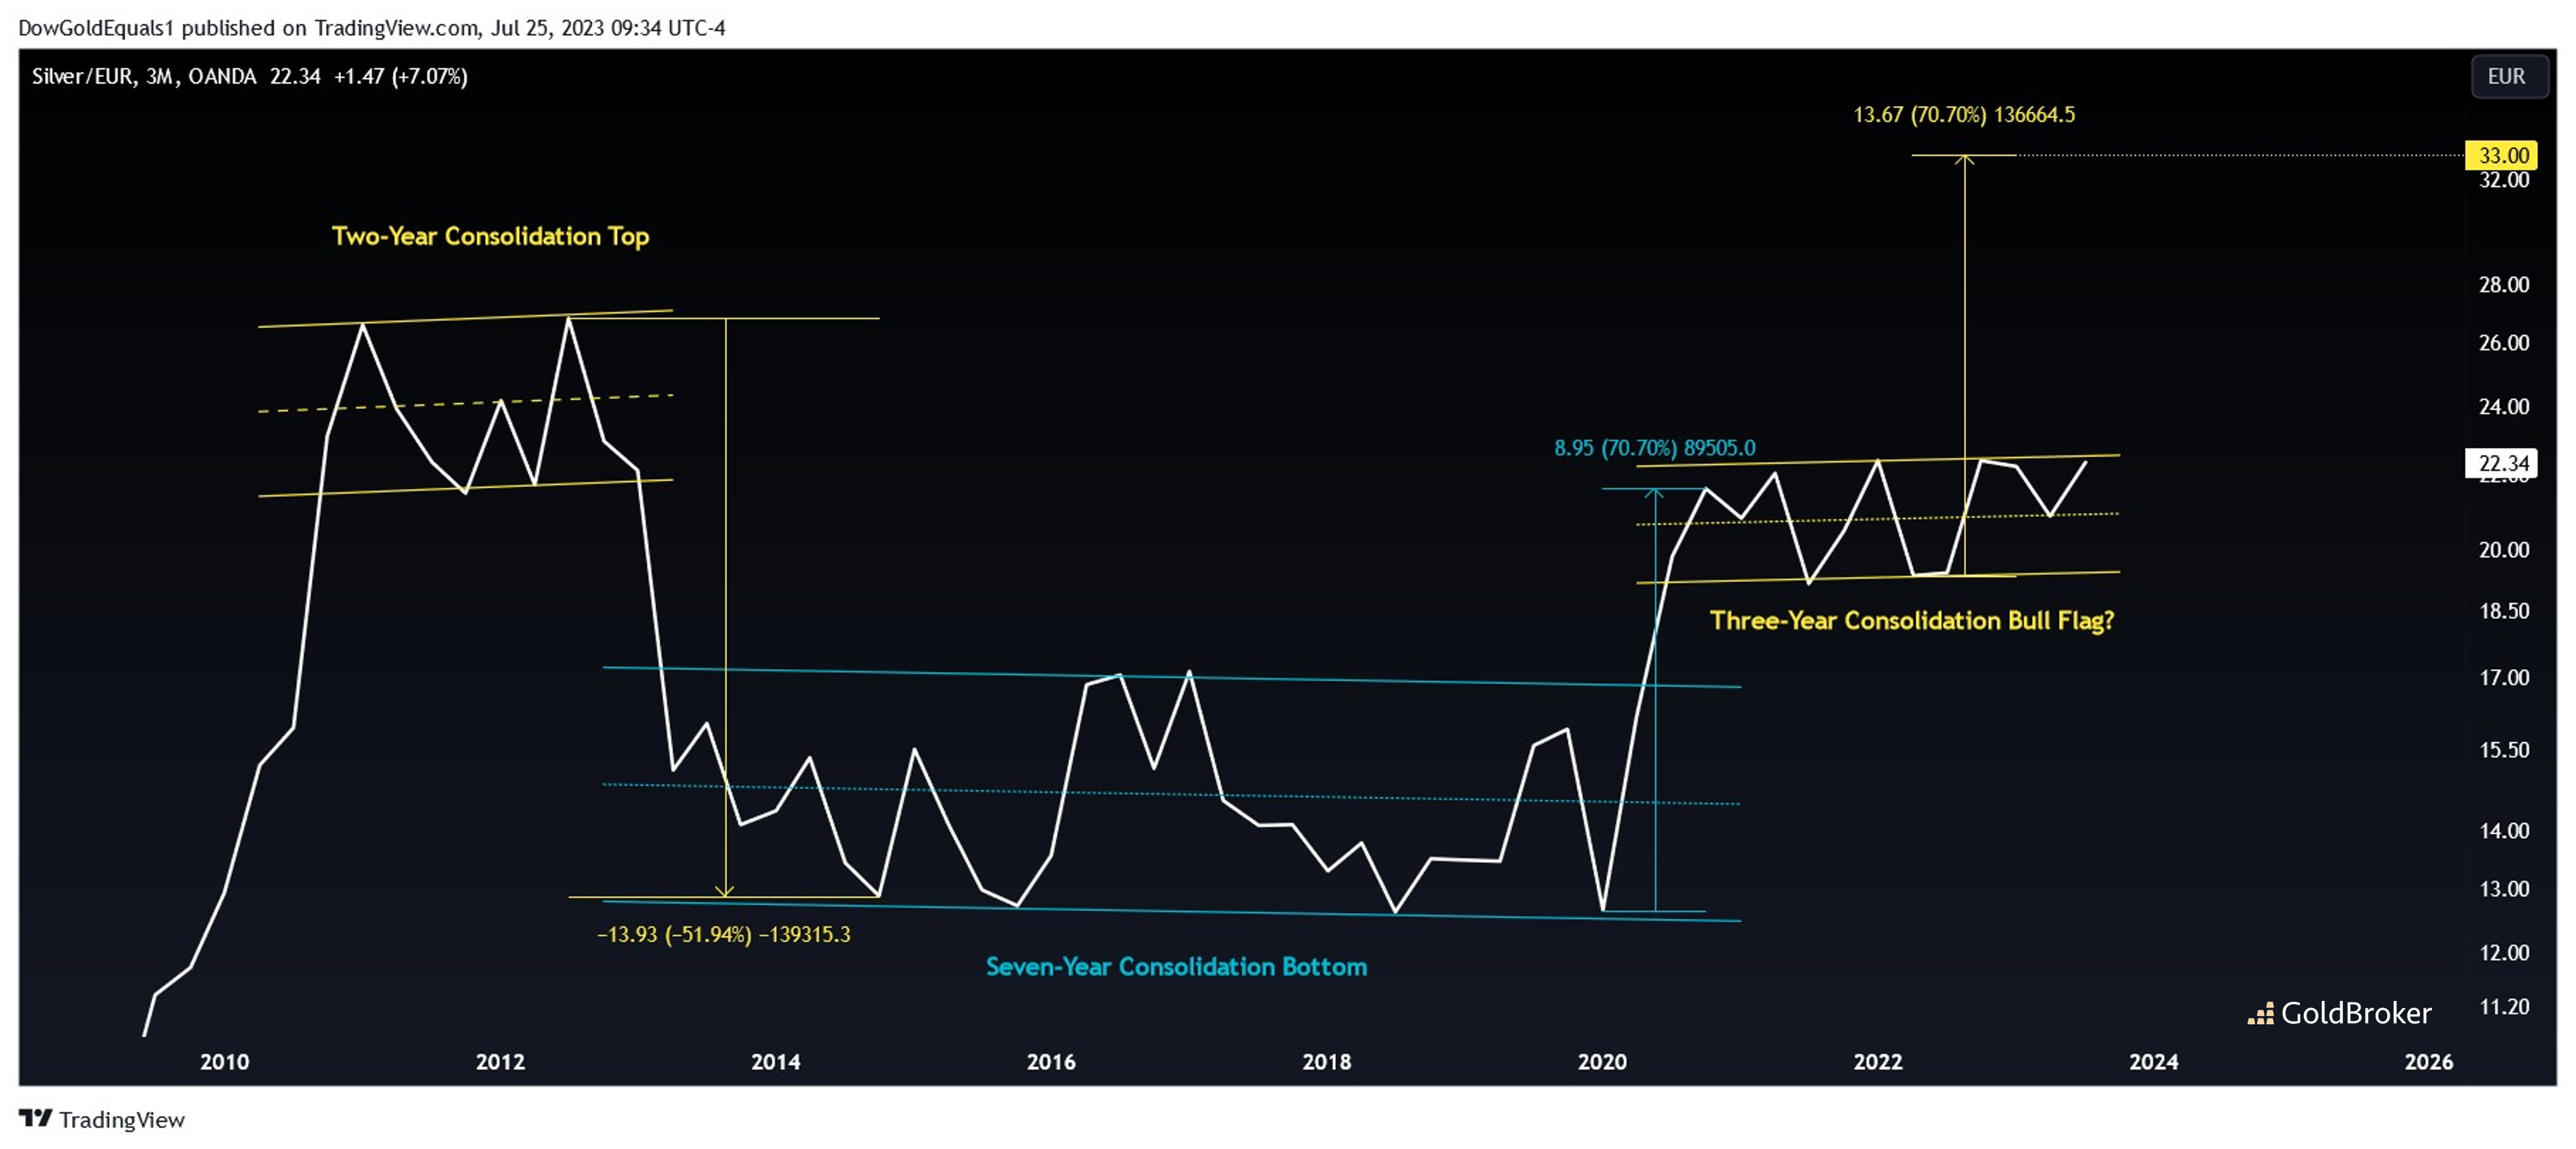
Silver/Euro quarterly paints a slightly different picture, one marked by a series of long term channel consolidations followed by major impulse moves. The first on our chart shows the two-year topping channel that formed in 2011/2012. A breakout from this channel produced a sharp 52% decline. From there, it took seven years for Silver/Euro to bottom, but when price finally broke free, it led to a quick 71% gain. Now, price once again has been consolidating within a channel, this time for three years. However, given what we've just seen in Silver/Dollar, as well as the set up in Silver/Euro following its major seven-year bottom, there is strong reason to believe that the current consolidation is a bull flag - and a breakout would provide a measured move to All Time Highs.
Reproduction, in whole or in part, is authorized as long as it includes all the text hyperlinks and a link back to the original source.
The information contained in this article is for information purposes only and does not constitute investment advice or a recommendation to buy or sell.


