This week, we'll look at several interesting ratio charts that plot gold against some of the world's best known consumer brands. These charts will reinforce my expectation that gold will remain in a secular bull market for years ahead while also highlighting the relative struggle these companies seem destined to face as consumers continue to see their discretionary income eroded by inflation and rising taxes.
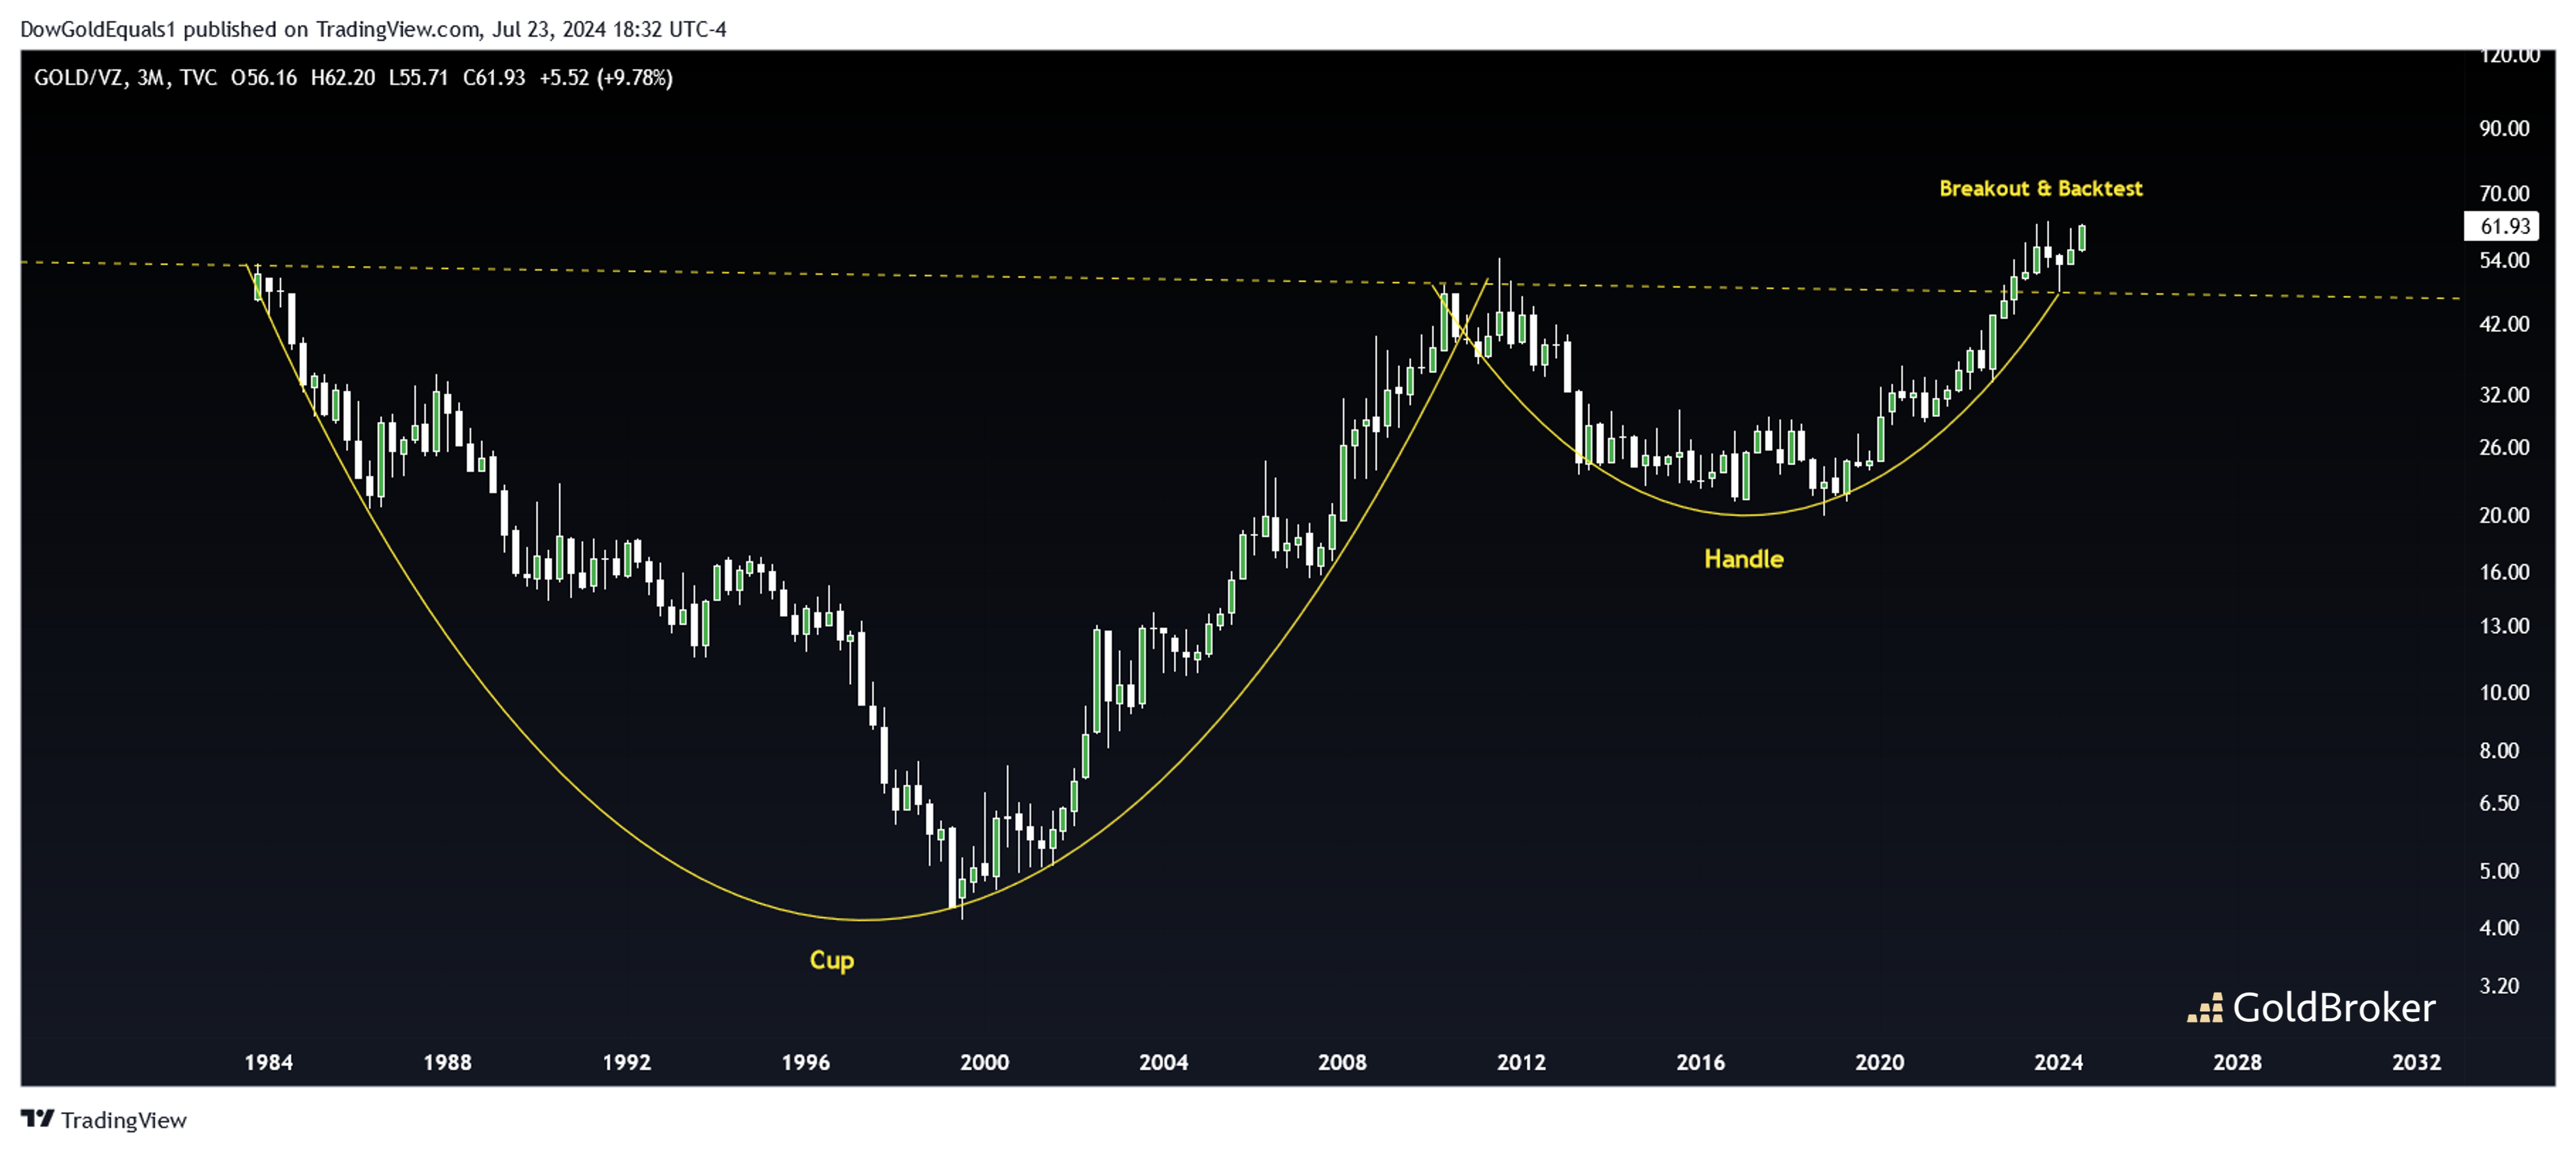
The first chart of Gold/VZ (Verizon) shows an amazing 40-year Cup & Handle pattern that has broken above and successfully backtested its neckline. This is a beautiful technical set up, and the next move should be impulsively higher.

The second chart of Gold/NKE (Nike) shows a massive 40+-year bullish falling wedge with a false breakout in 2021 followed by an impulsive upside breakout that began last year.

The third chart of Gold/TGT (Target) shows a massive 55-year wedge that has finally broken out and successfully backtested. Note the 20-year double bottom! Target is one of the largest retailers in the United States, and gold is about to destroy this stock on a relative basis.
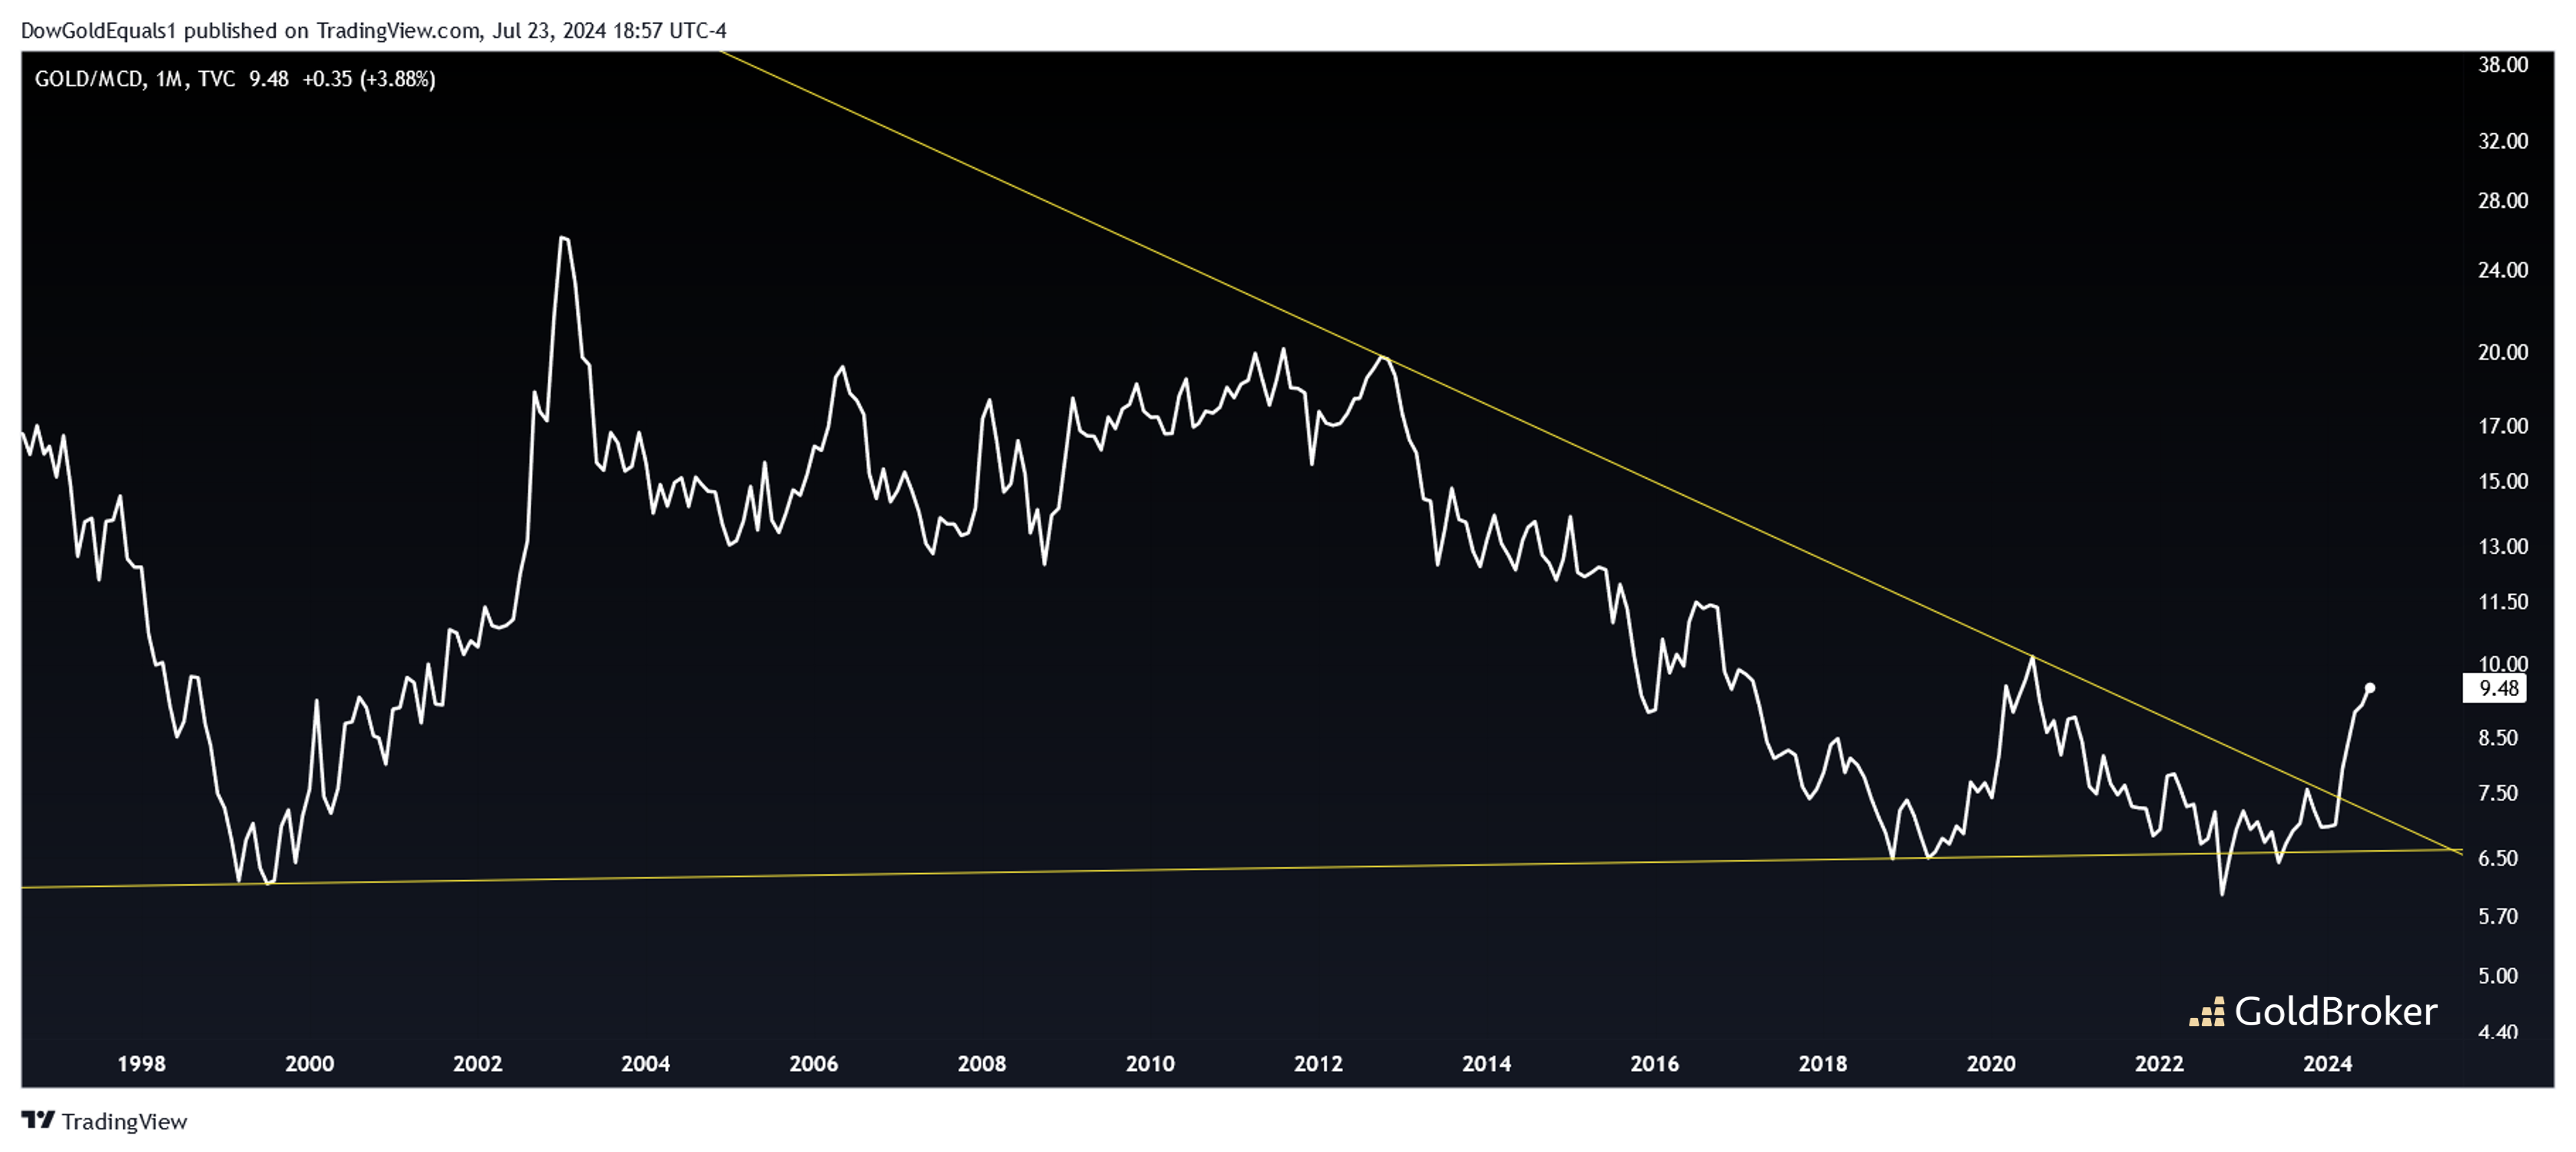
The final chart of Gold/MCD (McDonald's) shows a 25-year wedge with a massive upside breakout. Gold price is up about 50% against MCD over the past 18 months, and this move is just the beginning.
Do not ignore the clues that these charts provide. They all suggest that we are in for tough, recessionary times and that gold will be, as it always has been, the safe haven.
Reproduction, in whole or in part, is authorized as long as it includes all the text hyperlinks and a link back to the original source.
The information contained in this article is for information purposes only and does not constitute investment advice or a recommendation to buy or sell.


