As we start a new trading year, gold and silver are both presenting long term set-ups that may well propel price to much higher levels over the coming years.
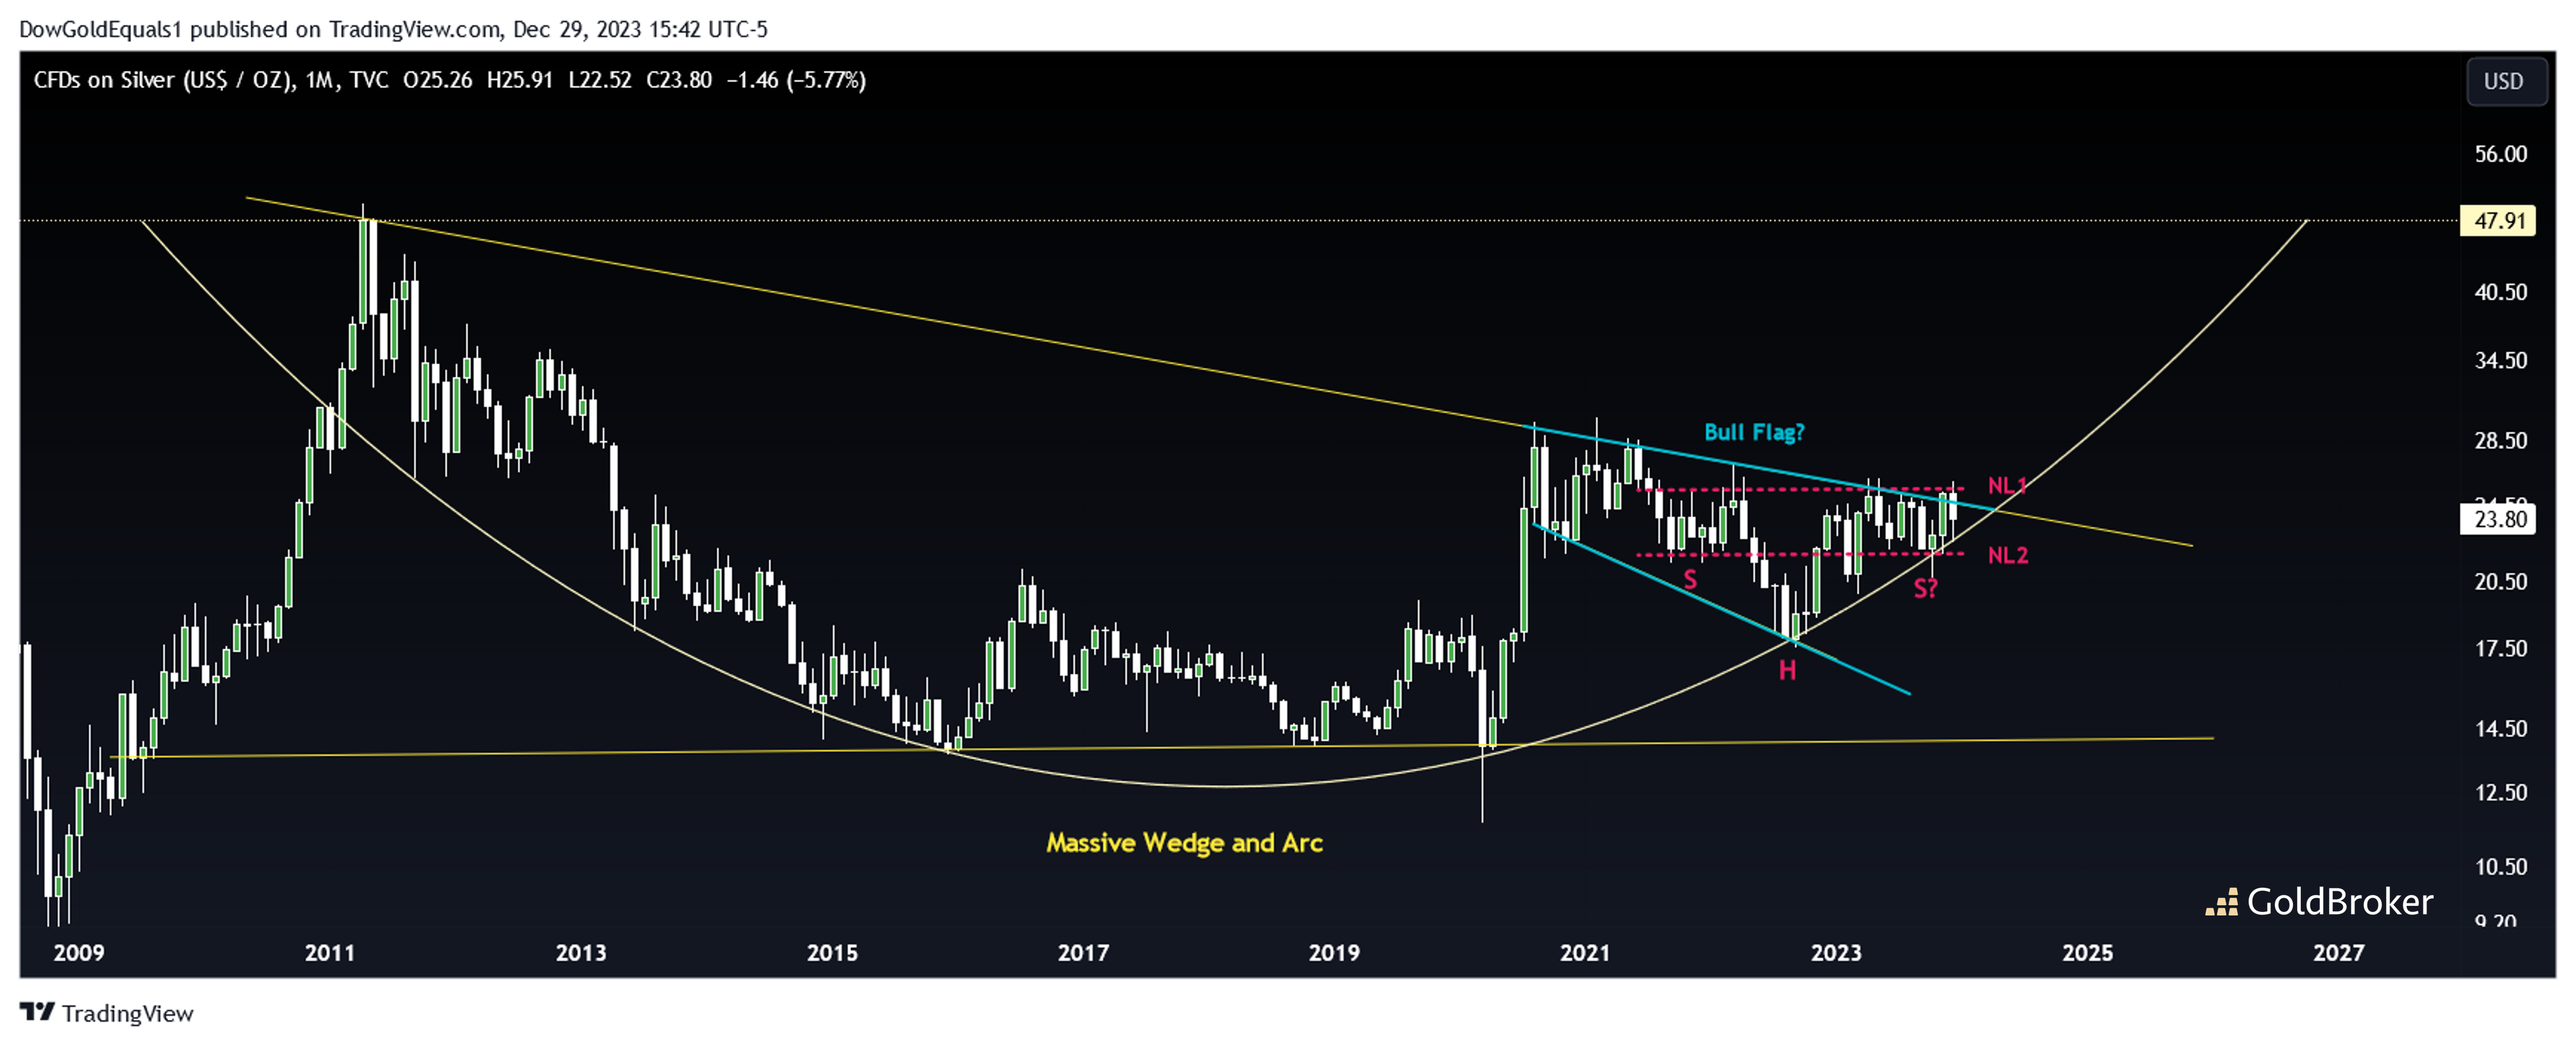
Starting with silver, note how price continues to obey the massive arc and wedge that I showed earlier this year. Within those patterns, a compelling bull flag continues to develop, and within that flag, a very possible inverted head and shoulders with two well-defined necklines (NL1 & NL2). The set up looks explosive and may ignite a 2x move over the next few years - toward the top of the arc.
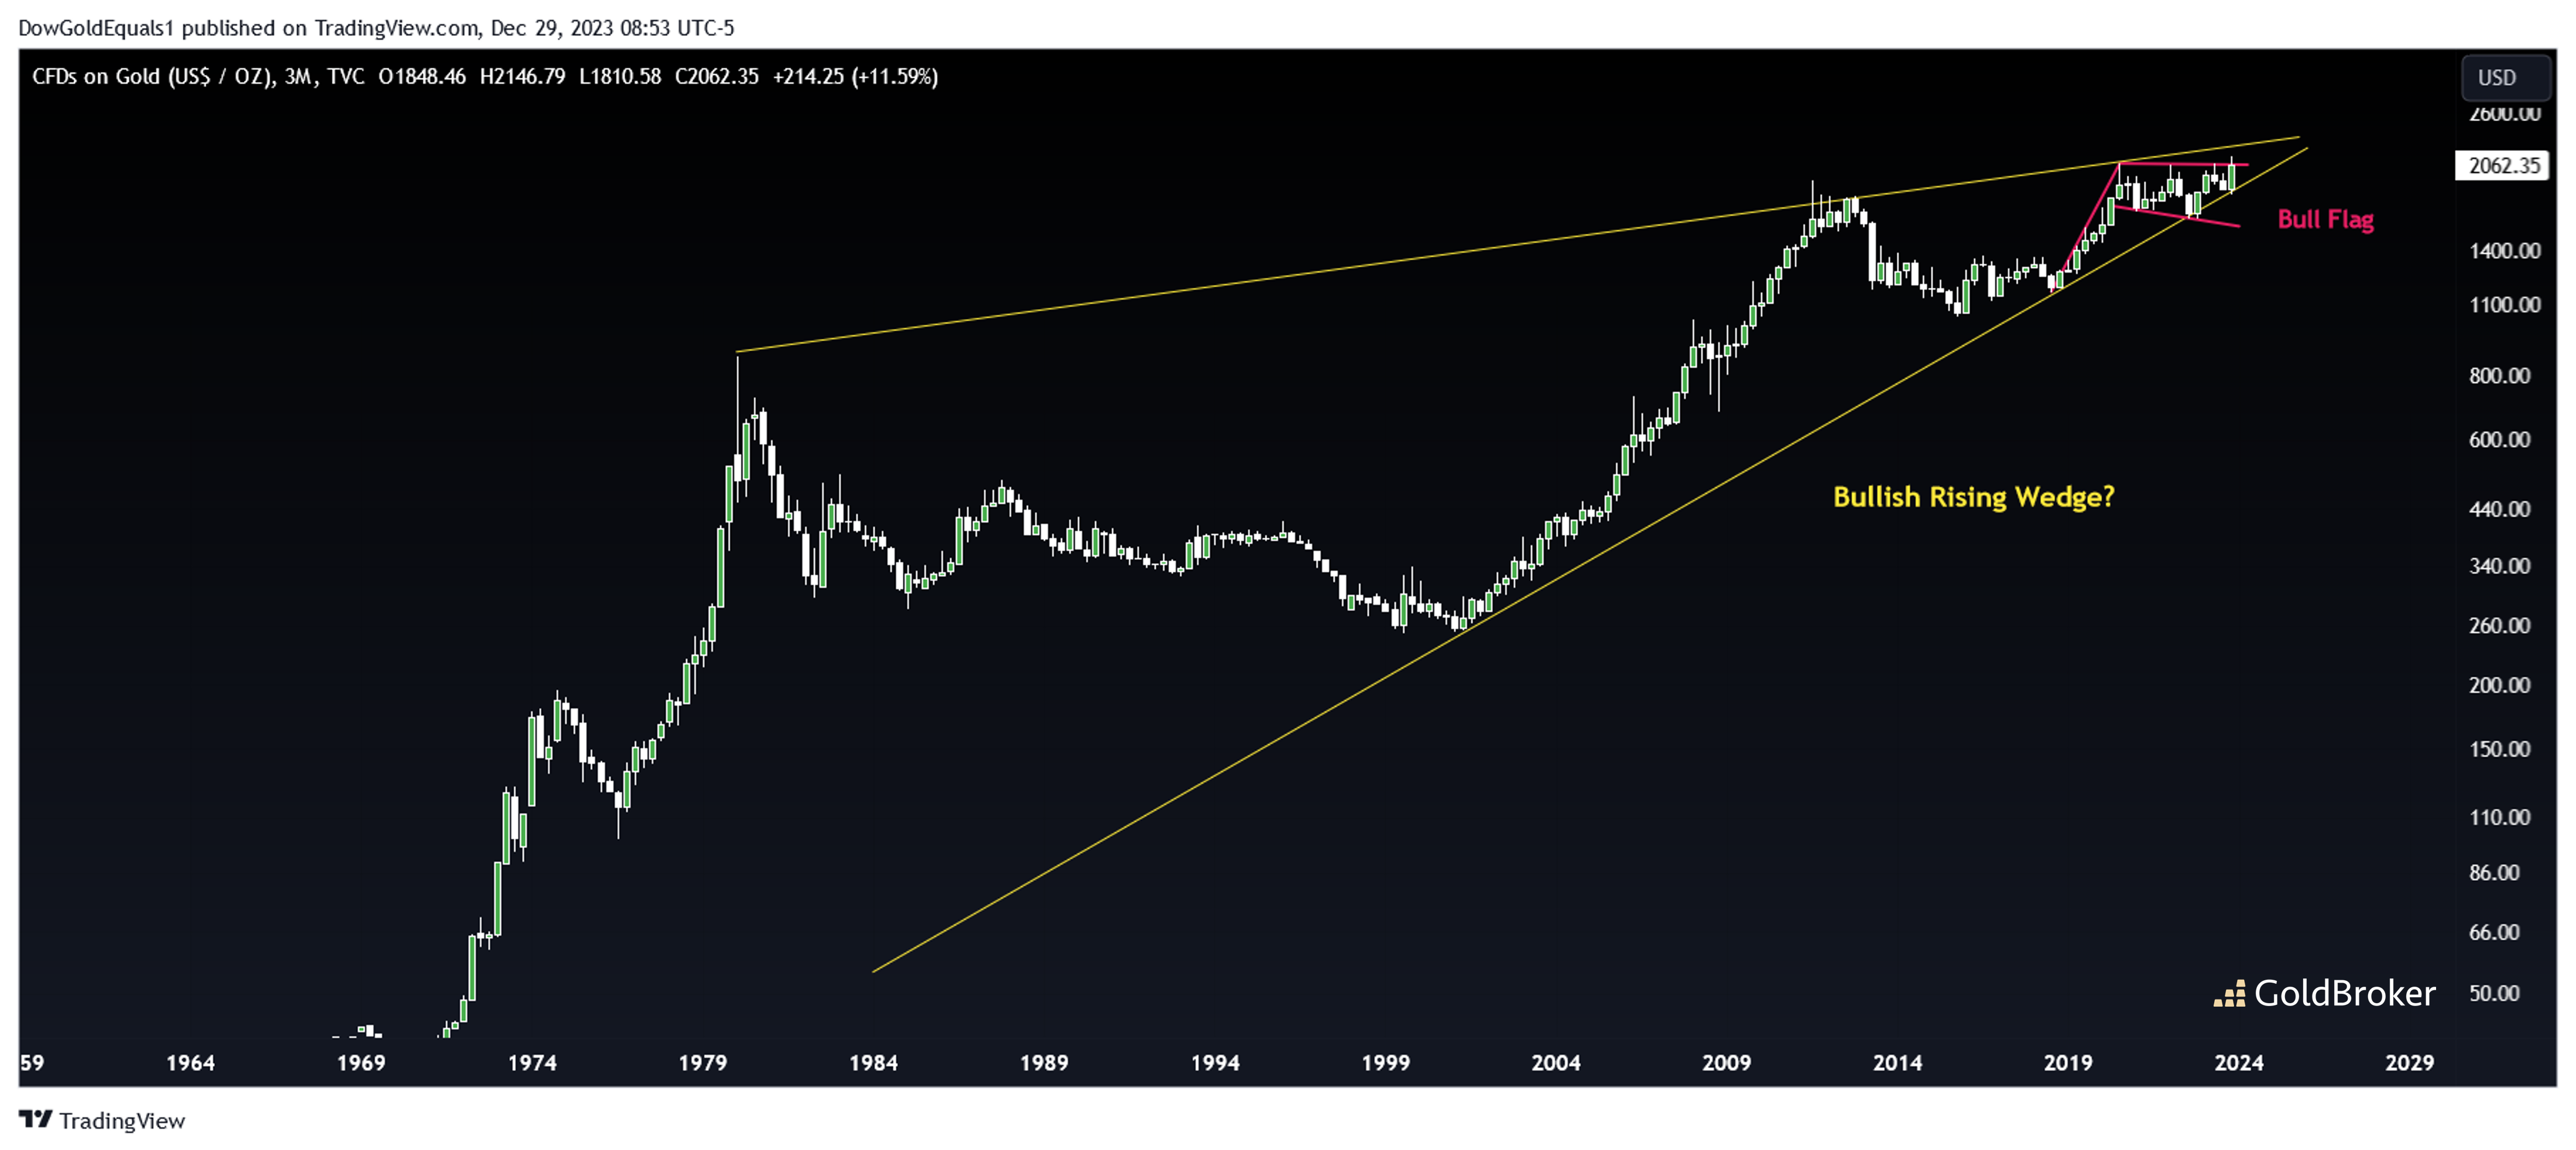
A long term chart of gold presents a rising wedge. Many analysts assume that a rising wedge is inherently bearish, but not so.
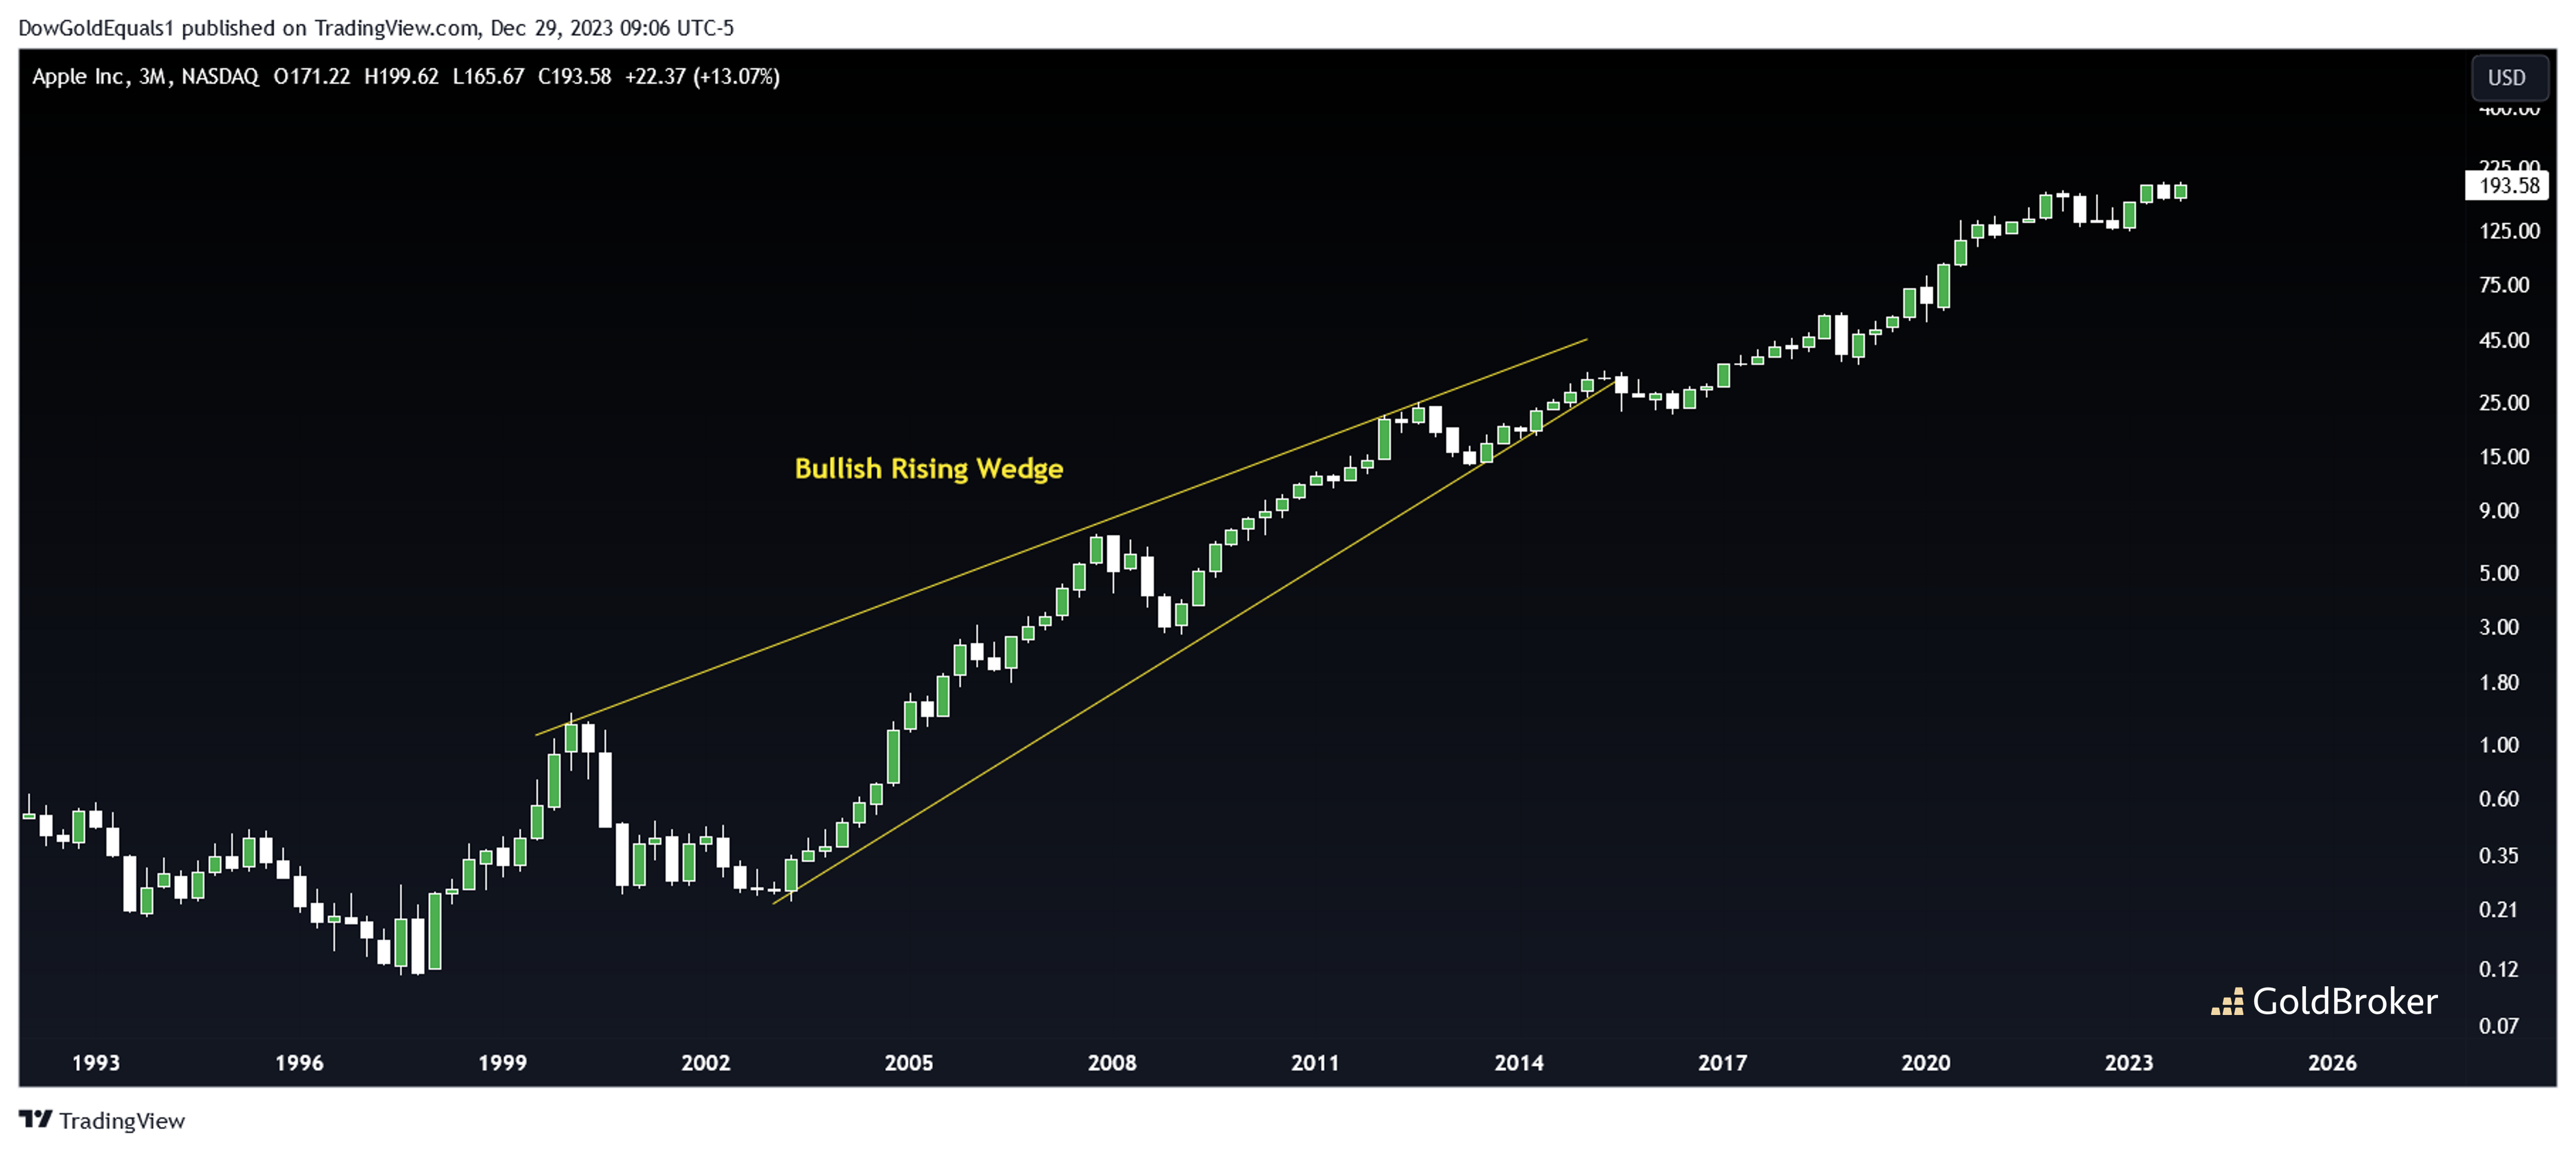
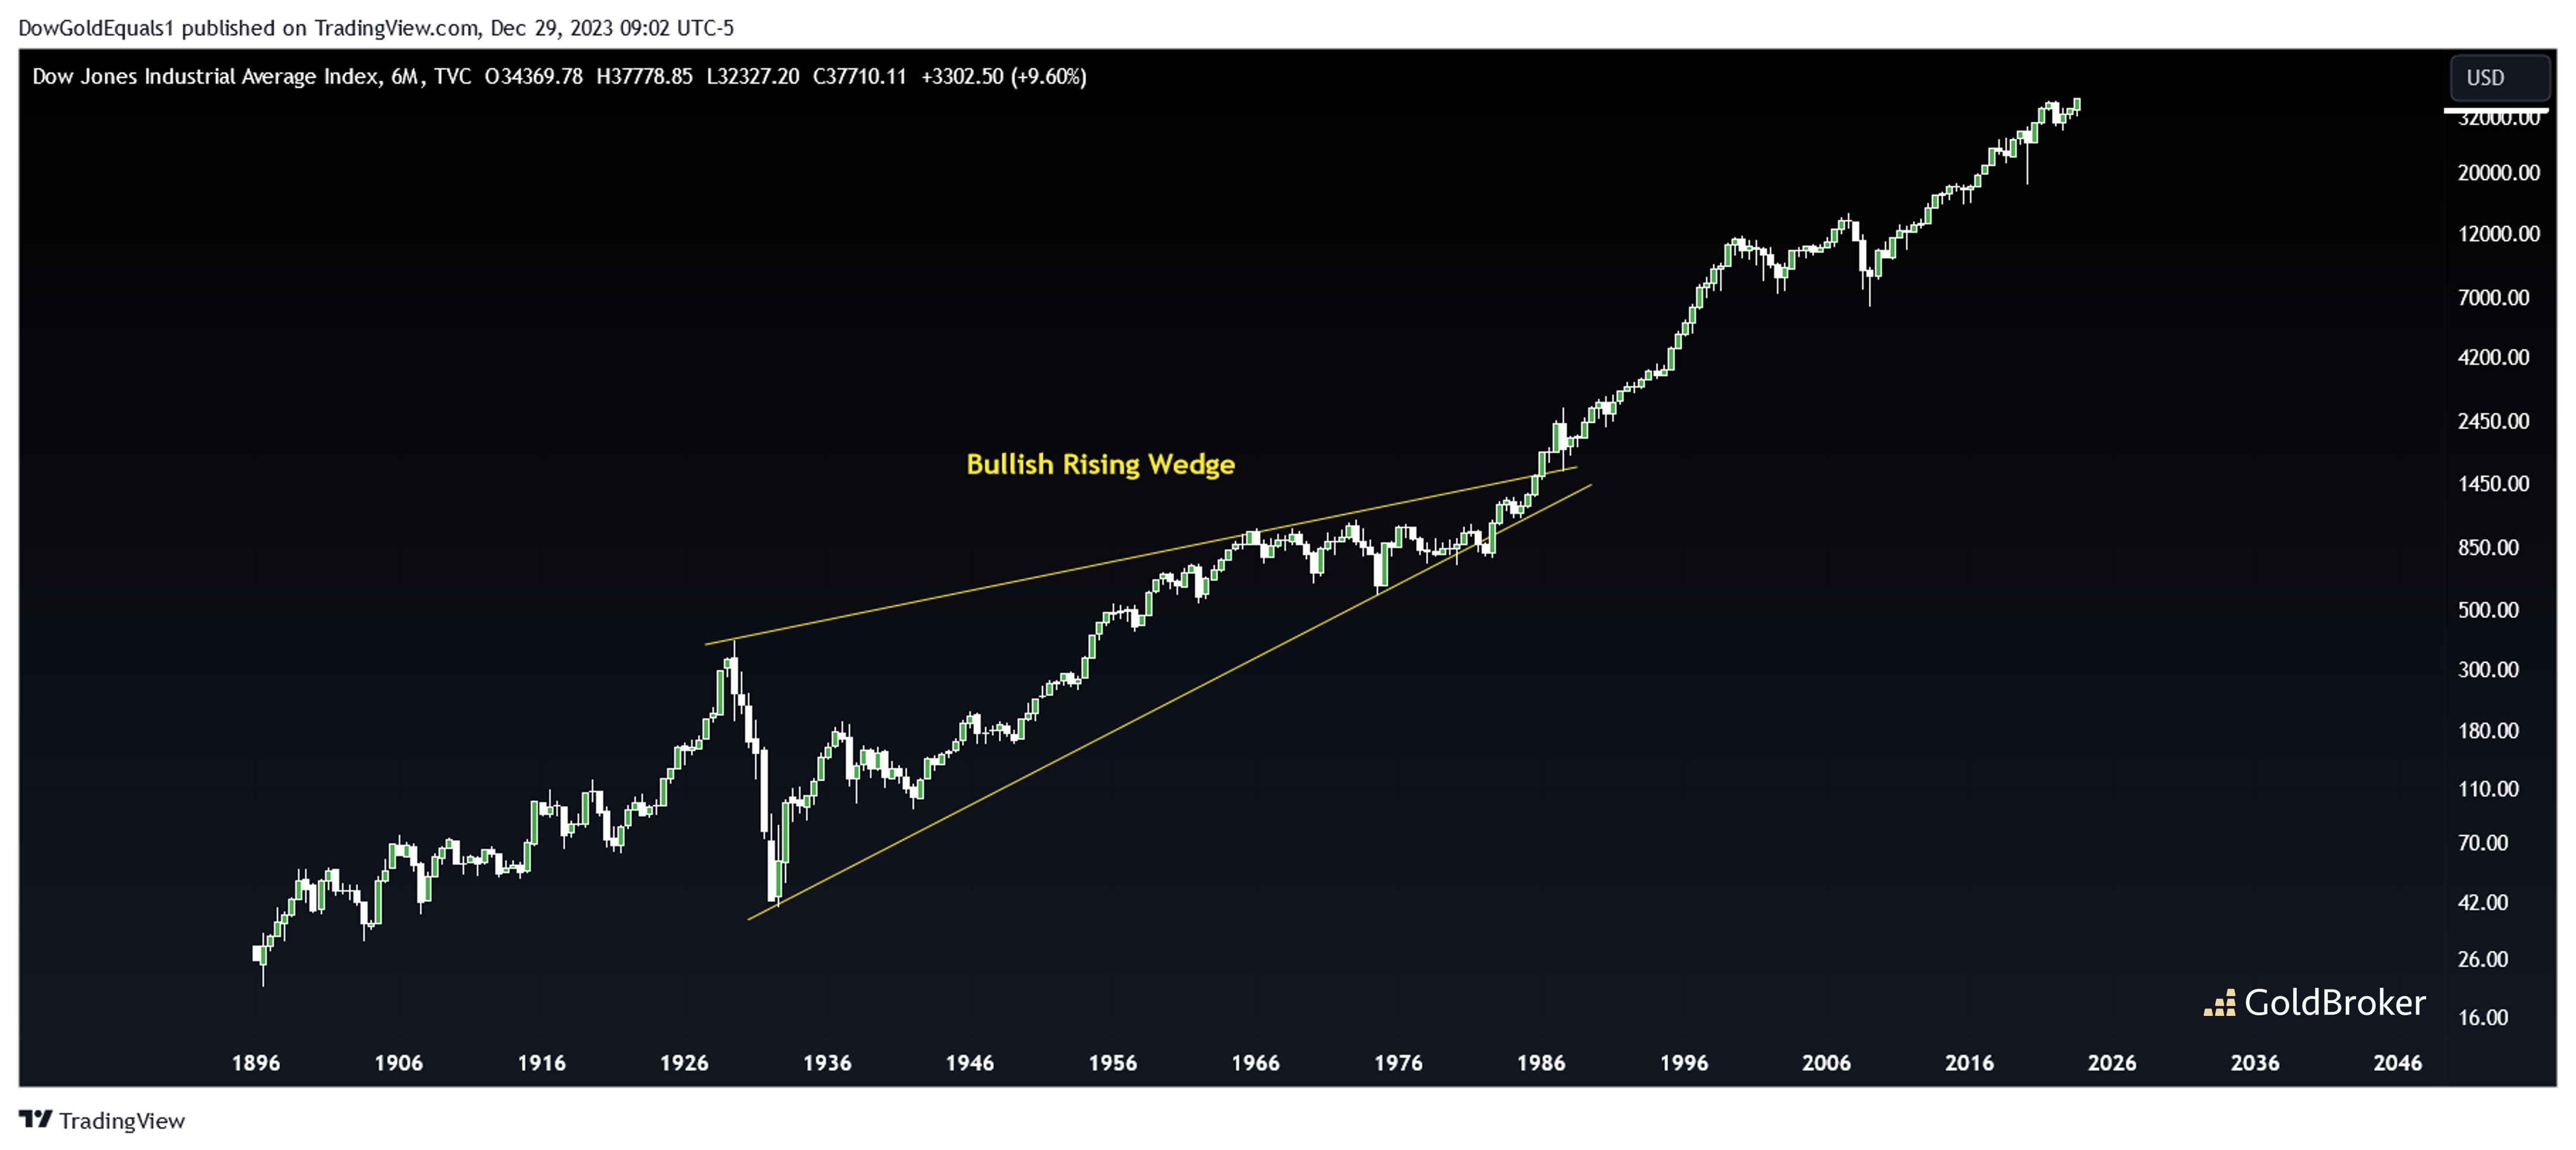
A bullish rising wedge also exists, as supported by the accompanying long-term charts of Apple and the Dow Jones Industrial Average, just to name two. Had a trader followed the Bearish Rising Wedge thesis, the Dow would have been sold in the mid-$1980s at under 1,000. Yikes! The Dow exited the Bullish Rising Wedge from a massive inverted head and shoulders that developed from the mid-1960s to the mid-$1980s. With gold, a bullish resolution looks quite possible as it builds out a bull flag near the apex of its wedge.
Reproduction, in whole or in part, is authorized as long as it includes all the text hyperlinks and a link back to the original source.
The information contained in this article is for information purposes only and does not constitute investment advice or a recommendation to buy or sell.


