This week, we'll change things up from our usual analysis on longer term charts and instead focus on the short term to see if there are any clues about where gold and silver are headed next.
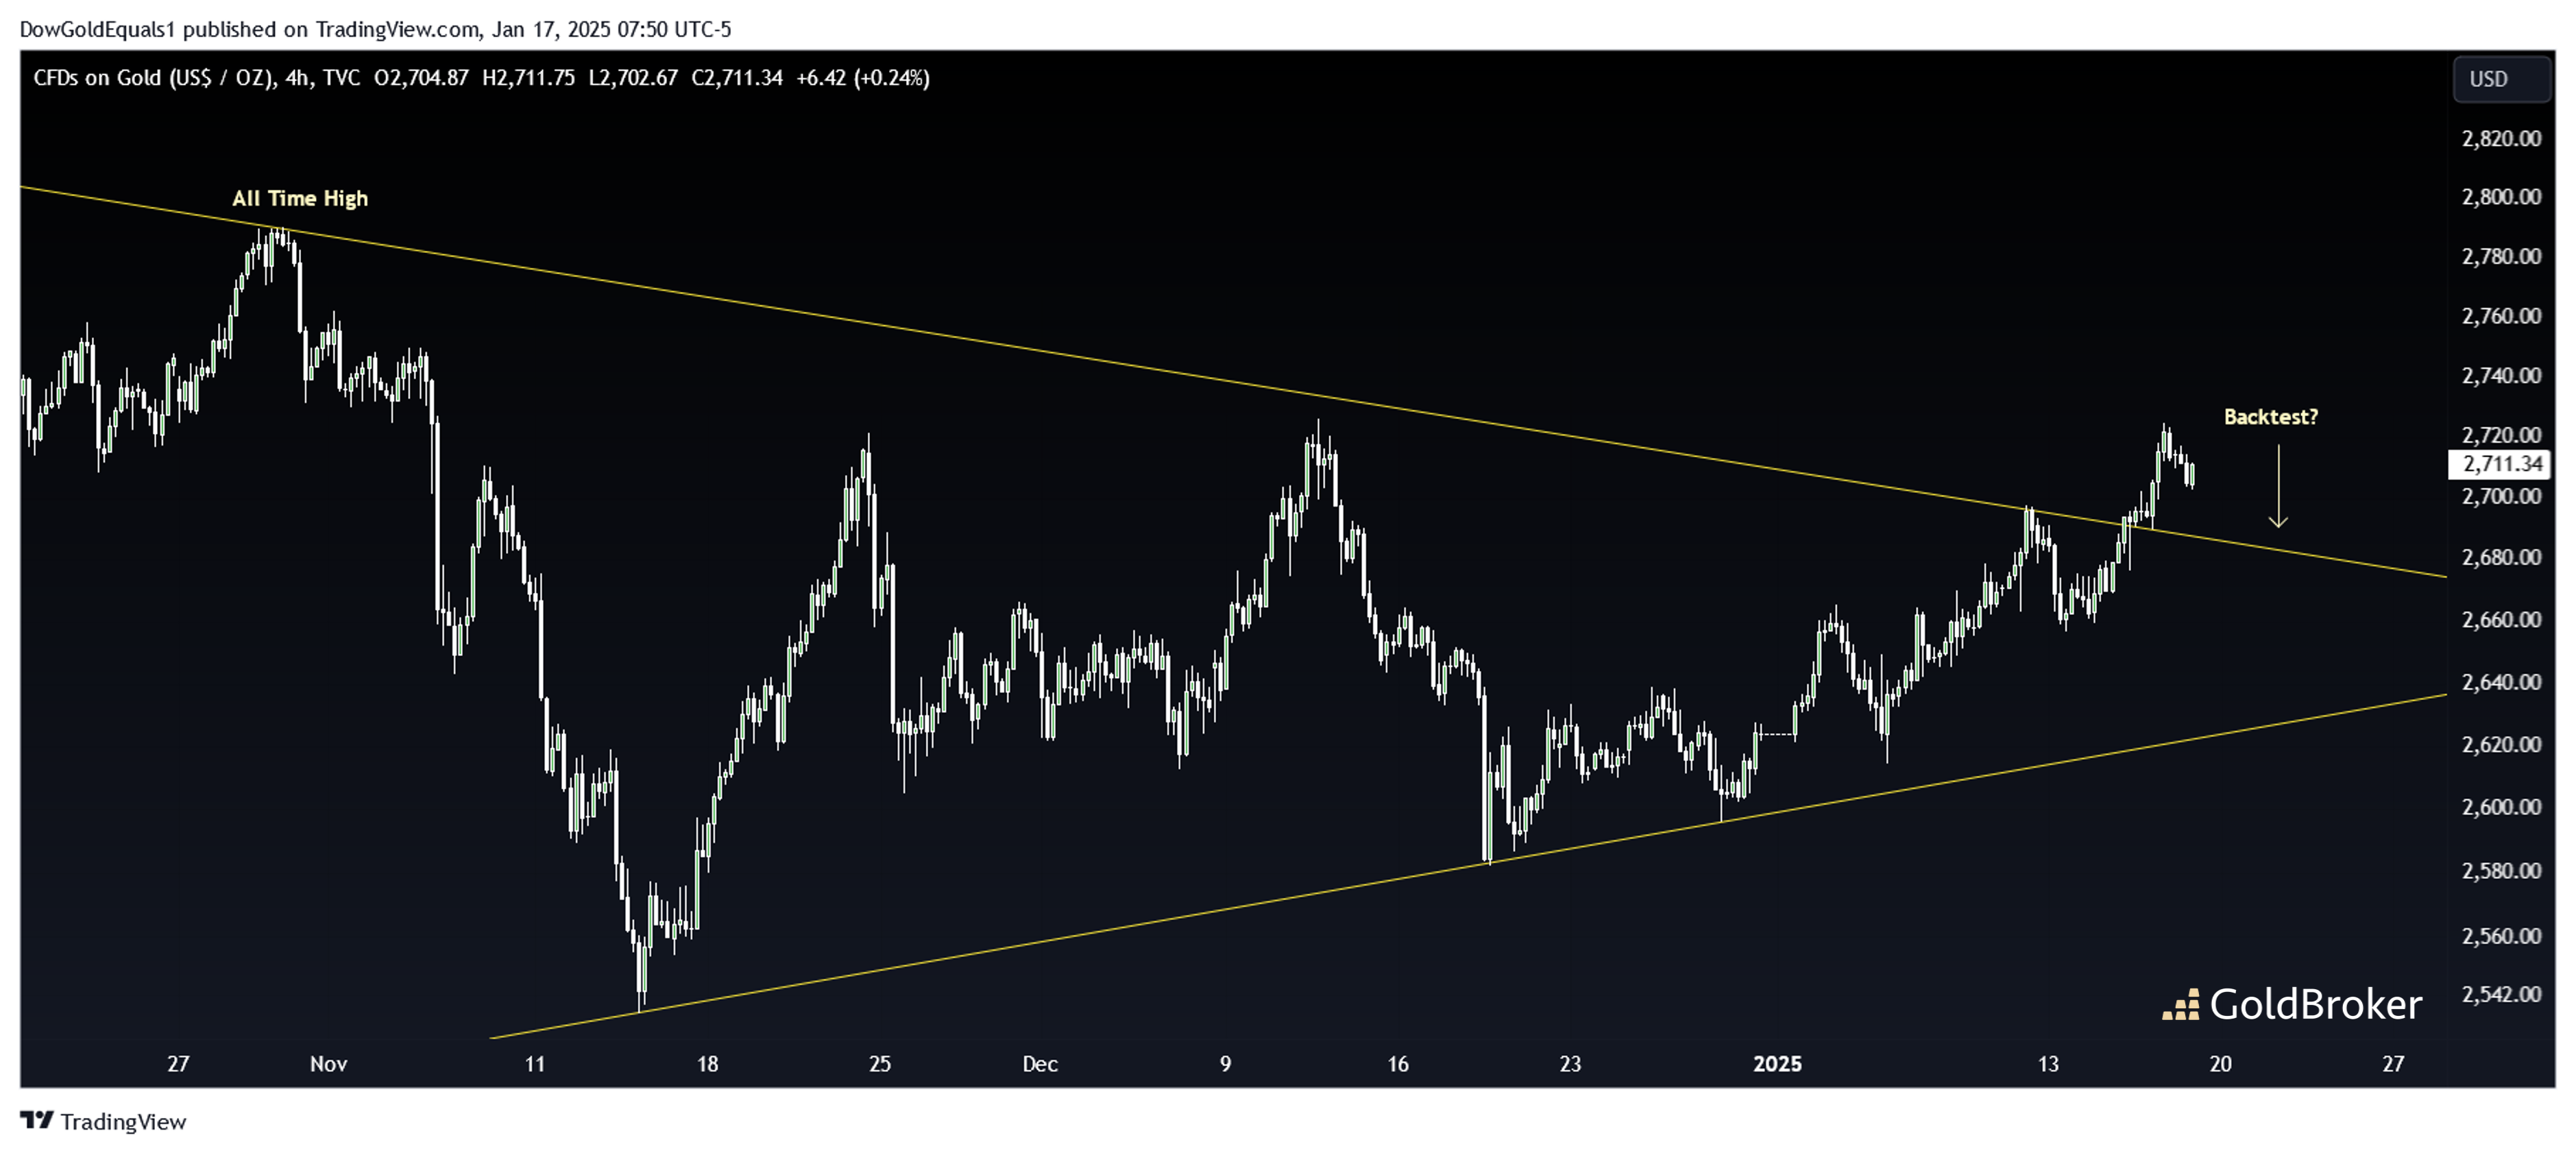
We'll start with a 4-hour chart of gold and see that it has created a triangle consolidation pattern since making its all time high back in October, 2024. Many of you will recall that gold was on an absolute tear last year, rising more than 20% over the five months leading into the all time high near $2,800, so it is actually pretty natural, healthy bull market behavior to see gold consolidating those gains. The chart shows us that gold has broken out of its consolidation pattern, but I would not be surprised to see a backtest to the mid-$2,600s before it begins its next leg higher over the next few months.
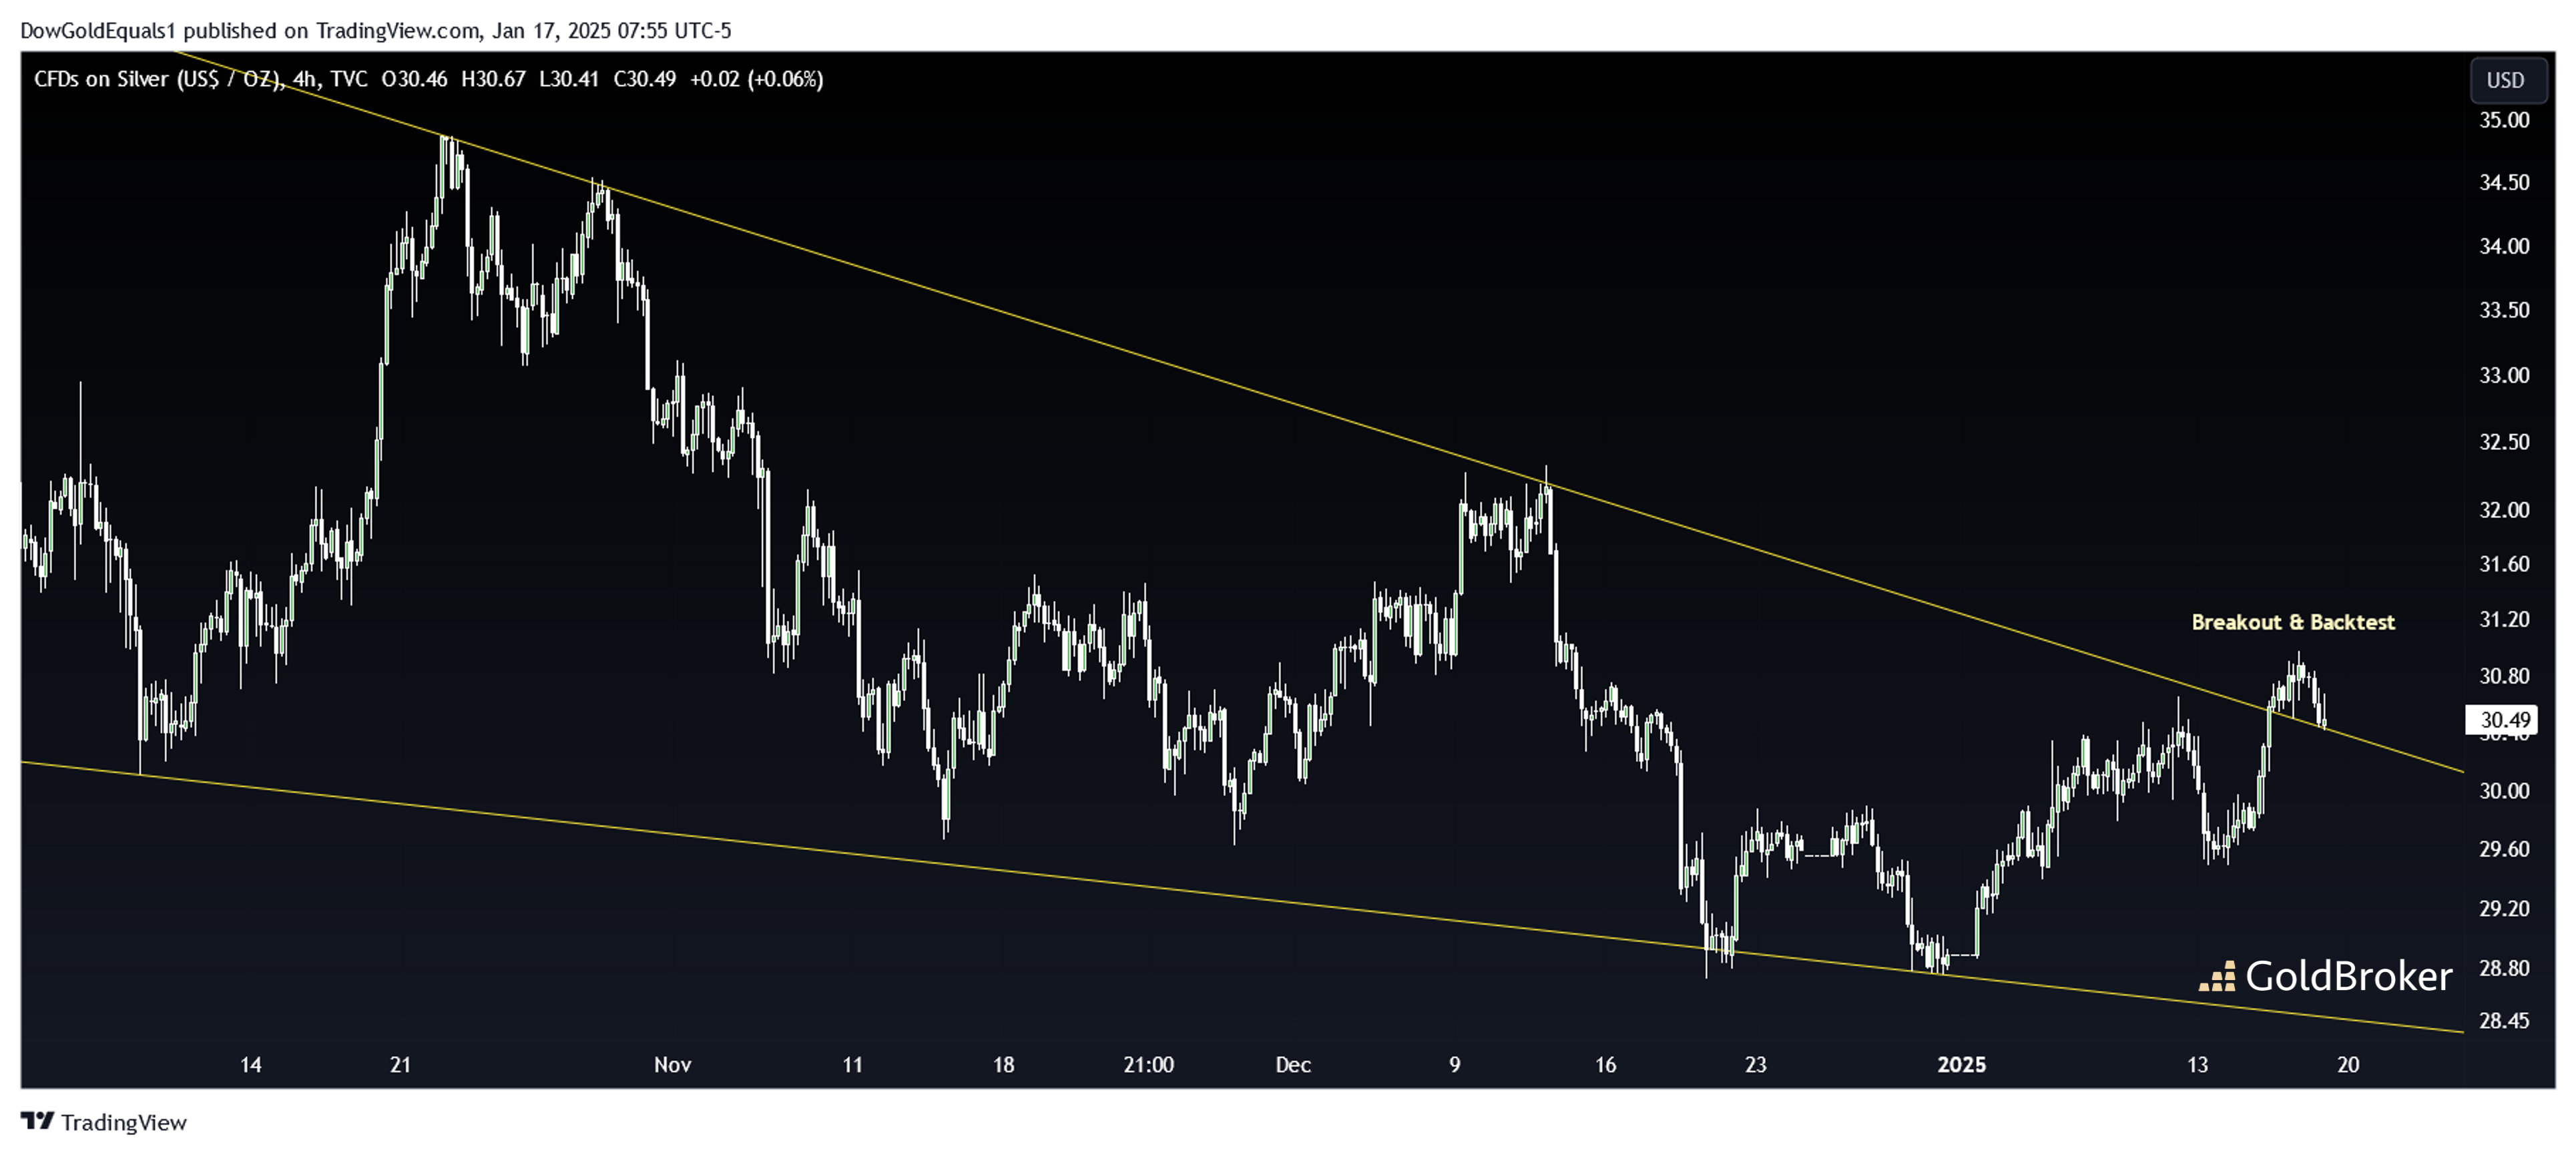
Silver's picture is similar to gold, though its triangle is a bit cleaner with more touch points. Silver also appears to be backtesting its triangle currently. Because this is such a short term chart, we may get a sense of whether the metals want to move higher over the next coming week.
I do want to emphasize that chart patterns can fail, and that shorter term patterns are far less reliable than the longer term charts we normally look at (which is why I focus primarily on those). However, within the context of the long term patterns that suggest we are in a secular bull market, these charts do suggest that the next leg higher may soon be upon us.
Reproduction, in whole or in part, is authorized as long as it includes all the text hyperlinks and a link back to the original source.
The information contained in this article is for information purposes only and does not constitute investment advice or a recommendation to buy or sell.


