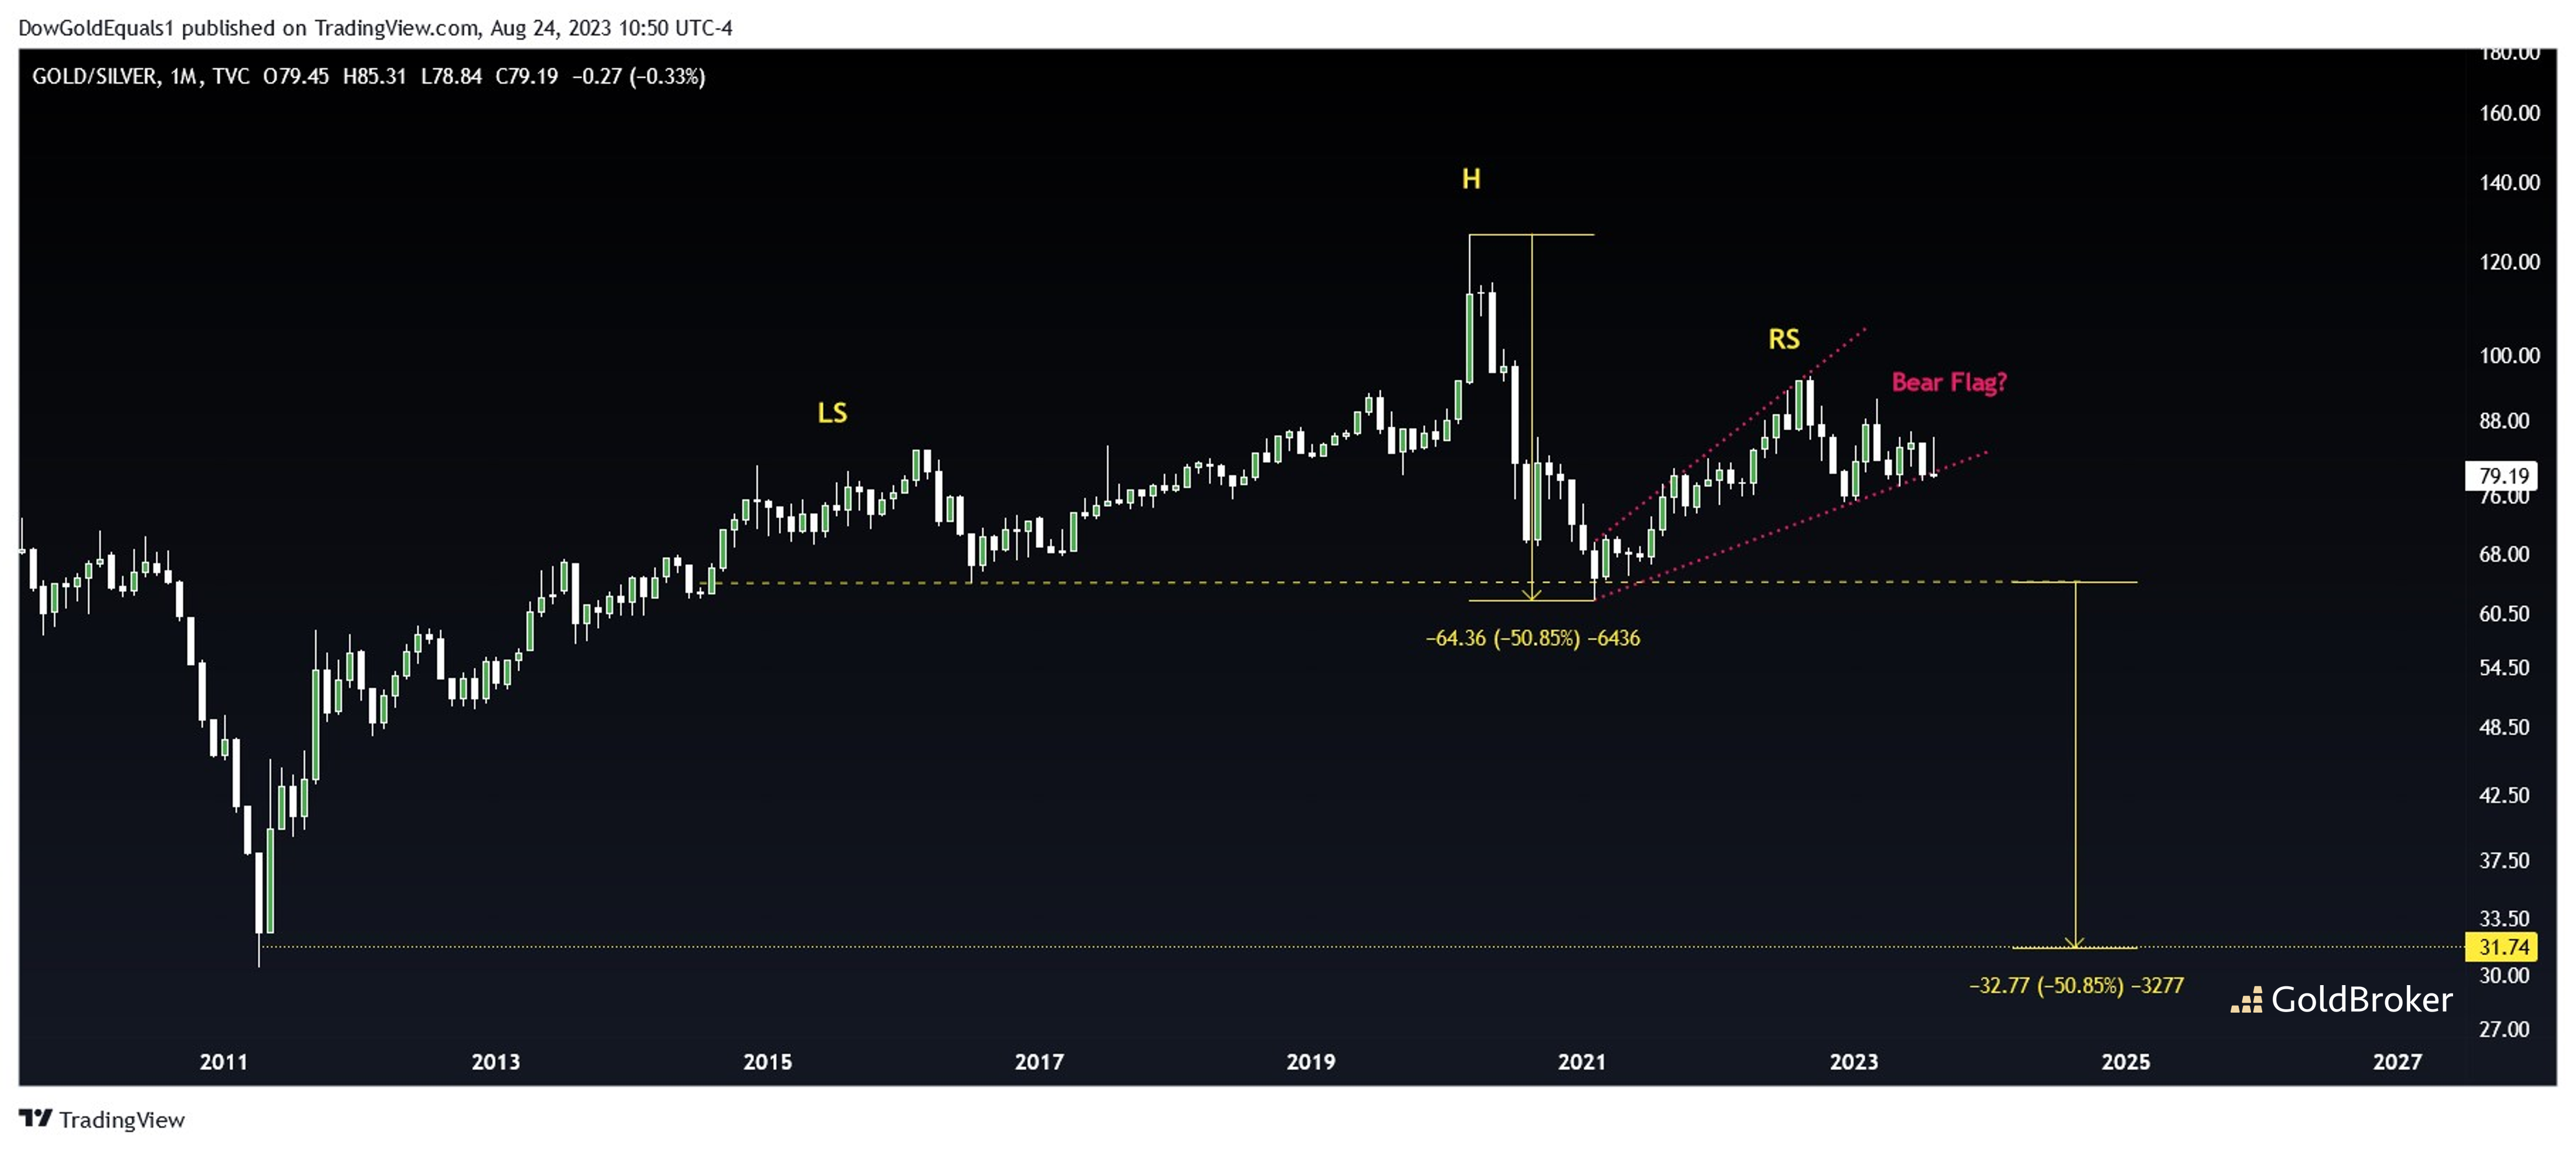
We last looked at the Gold Silver ratio in February, and I would like to revisit the monthly chart today as the pattern has continued to morph yet is still playing out largely as expected. Most notably, we can see that the Right Shoulder of the massive 12-year H&S pattern has developed a more defined bear flag and has really been testing the lower rail over the past few months. If you look closely, you'll see that the current candle for August looks extremely heavy at the moment and poised to break the flag. Once the flag breaks for good, we can expect an impulsive move lower toward the horizontal neckline of around 64. Such a move would likely see Gold at a new All Time High and Silver threatening the $30 range.
The big picture is what is really exciting for Gold and Silver investors. This is a very large, symmetrical and technically beautiful H&S taking shape. The measured move from the horizontal neckline corresponds nearly perfectly with the 2011 ratio lows near 30, which represented historic highs for the metal prices themselves. Should the H&S complete as expected over this decade, it will very likely represent a run in metals prices similar to the one we saw from 2001-2011 when Gold increased by 8X and Silver by more than 12X.
Reproduction, in whole or in part, is authorized as long as it includes all the text hyperlinks and a link back to the original source.
The information contained in this article is for information purposes only and does not constitute investment advice or a recommendation to buy or sell.


