By Clive P. Maund
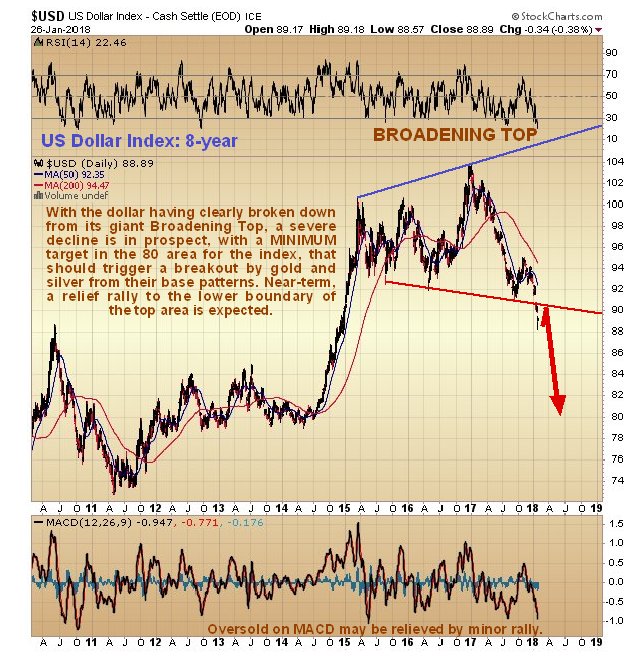
The key message of this update is that gold is getting closer and closer to breaking out of a giant Head-and-Shoulders base pattern that started to form back in the middle of 2013 and to point out that it won’t be stopped from doing so by any minor short-term reaction, especially as the dollar has just broken down from a giant top pattern and looks set to plummet, notwithstanding any near-term rally to alleviate its oversold condition.
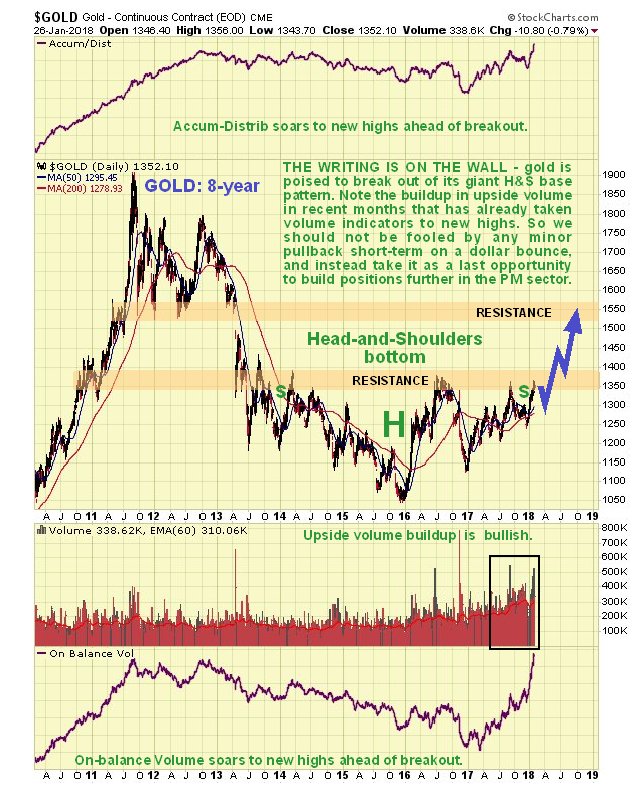
We’ll start by looking at the latest 8-year chart for gold which shows a fine flat-topped Head-and-Shoulders bottom. We can observe how a large and lengthy Right Shoulder has formed following the mid-2016 peak, that complements the large and lengthy Left Shoulder, making the pattern symmetrical, even if its component parts are a rather messy. We see how the price has risen up in recent months to challenge the resistance at the upper boundary of the pattern, and most importantly these runs at the resistance have been accompanied by a quite dramatic volume buildup, that has now driven both volume indicators to new all-time highs. This action by both volume indicators concurrently is very bullish indeed – it means that gold is destined to break out upside from this pattern into a bullmarket soon, regardless of what efforts the supposed “cartel” with their paper shenanigans make to stop it, and it’s not hard to see why given how much physical has been mopped up in recent years by countries such as China, that understand gold’s true value. Upon breaking above the nearby band of resistance, the 1st target for gold is the quite strong resistance in the $1520 - $1560 area.
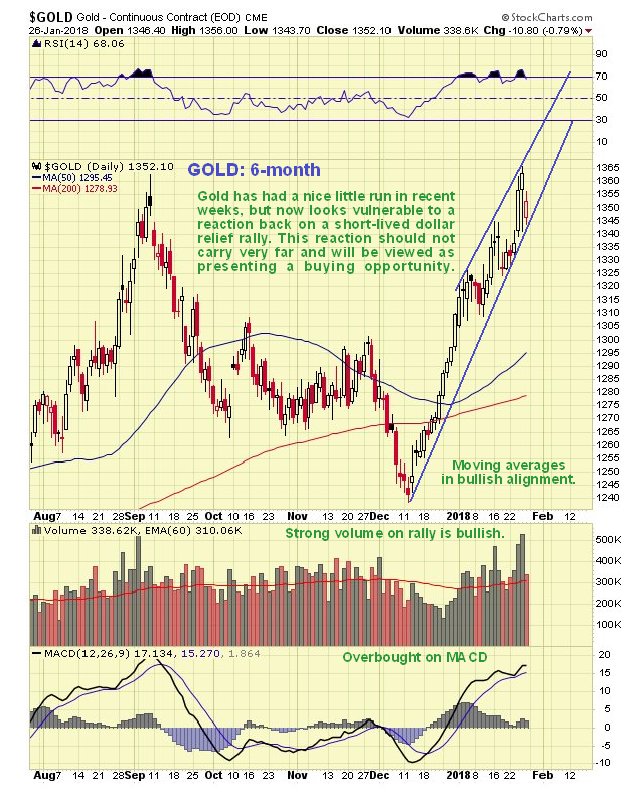
On gold’s 6-month chart, however, we can see that it has had a nice run in recent weeks that has resulted in it becoming rather extended, and with sentiment readings now very bullish, we should not be surprised to see a modest pullback that would probably be occasioned by a relief rally in the dollar to alleviate its oversold condition. We can use any such pullback to do additional buying, especially of gold and silver stocks.
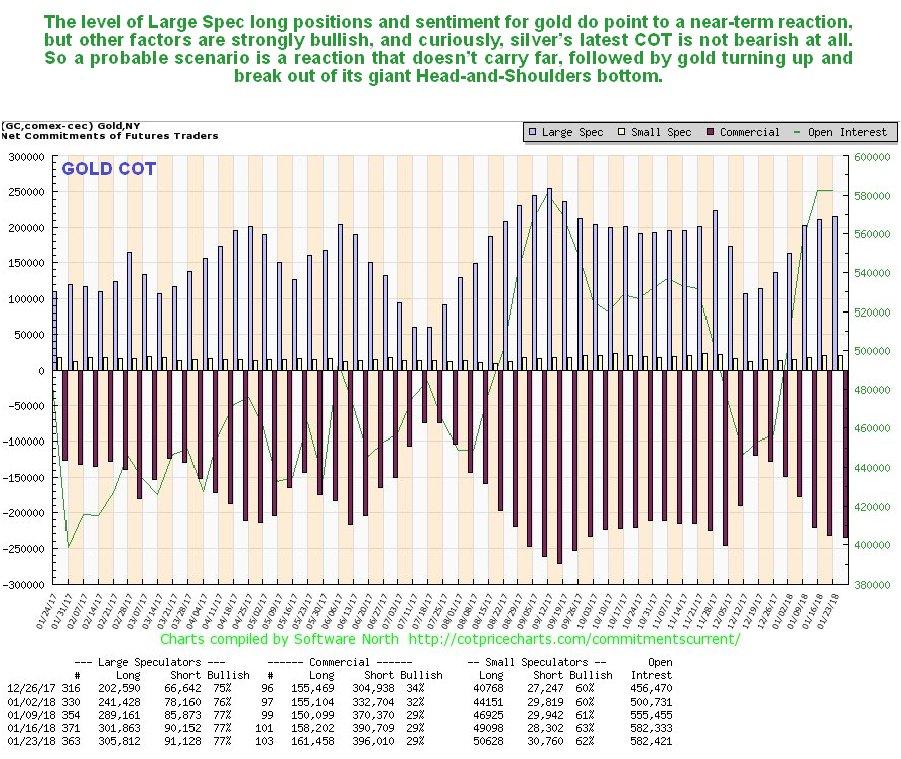
Gold’s latest COT shows that Large Spec long positions have risen to quite a high level, not enough to prevent it rallying further, but to a level that makes a reaction back more likely, and any such reaction would put gold in a stronger position to mount a sustainable breakout a little later.
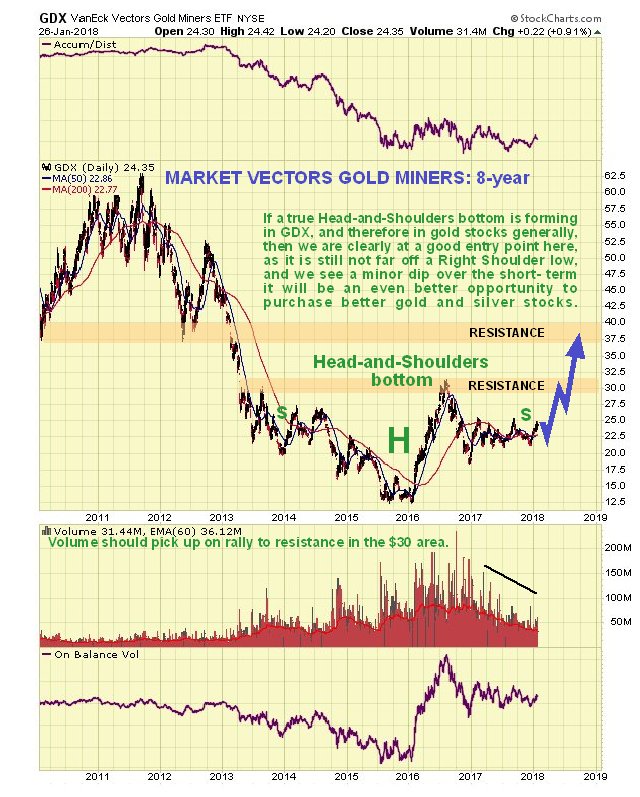
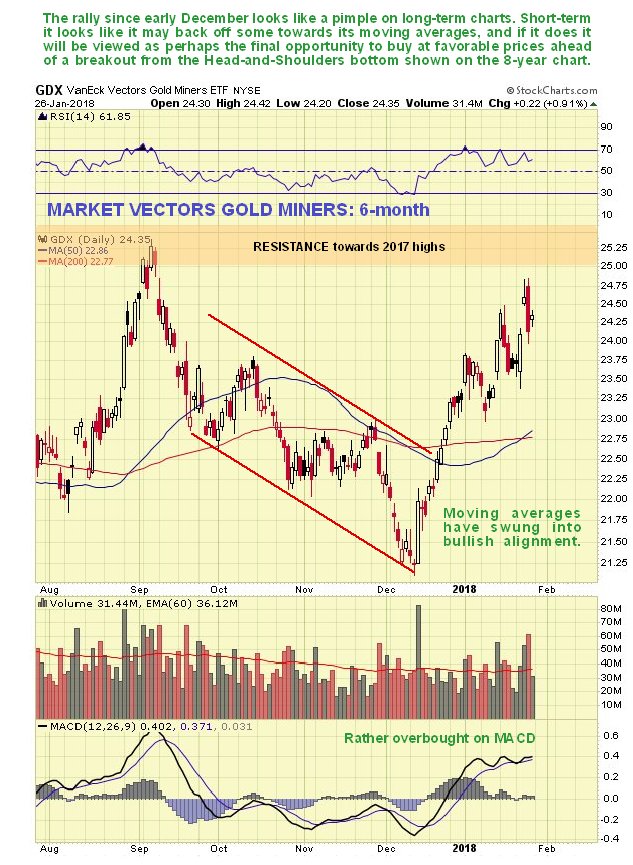
On the 6-month for GDX we can see that it has had a good run since mod-December, like gold itself, but being close to resistance now and starting to roll over, there is fair chance of its dropping back some towards its moving averages, and if it does it will present an even better opportunity to buy mining stocks at better prices.
A big reason for gold getting ready to break out is the dollar having just broken down from its large Broadening Top formation, which happened over the past 2 weeks. On the 8-year chart for the dollar index we can see that this looks like a clear and decisive breakdown, and while it will be normal for it to now rally back in a deceptive manner over the near-term to the lower boundary of the Broadening Top, it should then go into decline again and drop swiftly to its initial downside target in the 80 area, as shown by the red arrow on the chart. Obviously, such a drop is very big and will have major ramifications for most markets, not least of which is the Precious Metals market.
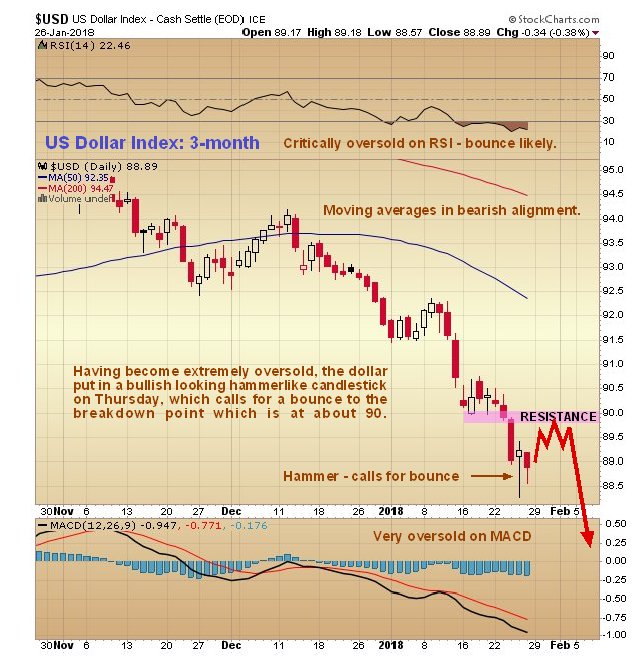
On the latest dollar index 3-month chart we can see its breakdown move this month in detail, and we can also see how it has become very oversold on short-term oscillators, making a near-term rally to relieve this oversold condition likely. Thus it is interesting to observe that a bullish looking hammerlike candlestick formed on Thursday, and we now want to see the volume associated with this candle which we can do via a proxy, but first we should note how far any rally is likely to get – it will probably get no further than the resistance at the underside of the bear Flag that formed about a week ago, as shown on the chart, which should coincide with a minor dip by the Precious Metals sector.
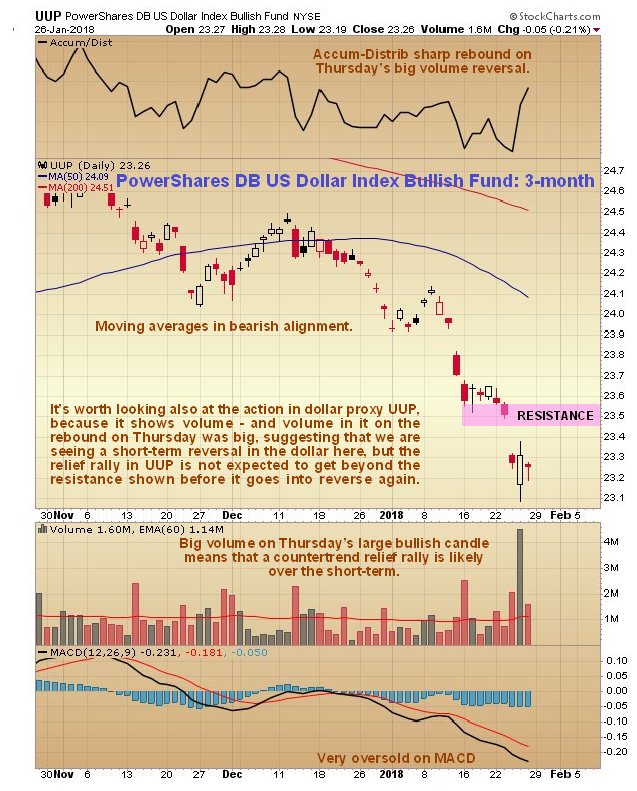
The 3-month chart for dollar proxy PowerShares DB US Dollar Index Bullish Fund (UUP) shoed that at the time that hammerlike candle formed on the dollar index chart on Thursday, a large white candle formed in UUP on very strong volume, driving it Accum-Distrib line steeply higher. This is a strong sign that a relief rally is about to start in the dollar, although as detailed above, it shouldn’t get very far before the larger downtrend reasserts itself.
So there we have it – a very bullish picture for gold indeed, notwithstanding any short-term dip, and it is worth pointing out in closing that rising interest rates are good for gold, and that a reversal in the stockmarket will also be good for it, as gold will be in demand again as a safehaven, especially as Treasuries are no longer an option, and with everyone bullish on the stockmarket now, and everyone who wants in in, a reversal looks imminent.
Original source: Clivemaund
Reproduction, in whole or in part, is authorized as long as it includes all the text hyperlinks and a link back to the original source.
The information contained in this article is for information purposes only and does not constitute investment advice or a recommendation to buy or sell.


