In early June, I wrote that the U.S. economy was much more fragile than reported, despite seemingly solid indicators. In reality, it was already faltering more than it appeared. In New York, Main Street was emptying, and tourism was declining under the combined effect of boycotts and trade tensions: -20% air traffic from Canada, -35% at land borders, -12% European bookings, representing up to $8.5 billion in potential losses for the sector. Inflation had pushed consumers towards low-cost options, while households were going into debt to cover their basic needs: 49% had resorted to BNPL (Buy Now, Pay Later) — including 64% of 18-28 year olds — 25% used it for food purchases (compared to 14% a year earlier), and nearly half (48%) now say they regret it.
Fundamentals were deteriorating: national income declined, consumption was revised to +1.2% in Q1, defaults rose (credit cards, cars, students), tax revenues fell by $100 billion (-3.6%), inventories were high, and investment and hiring declined. Leading indicators were already flashing red (JOLTS, surveys, business confidence), while monetary policy remained restrictive. The contraction in liquidity was still only partially offset by credit, which was supporting the markets in an artificial and precarious manner.
Massive revisions to the labor market subsequently confirmed this slowdown, which had been anticipated in June.
The situation in the US labor market now highlights its profound fragility, after two years of embellished statistics. In September, the Bureau of Labor Statistics made the largest negative revision in the history of payrolls: 911,000 “phantom” jobs were removed from the official records. Over three years, that's nearly two million jobs announced... but never created.
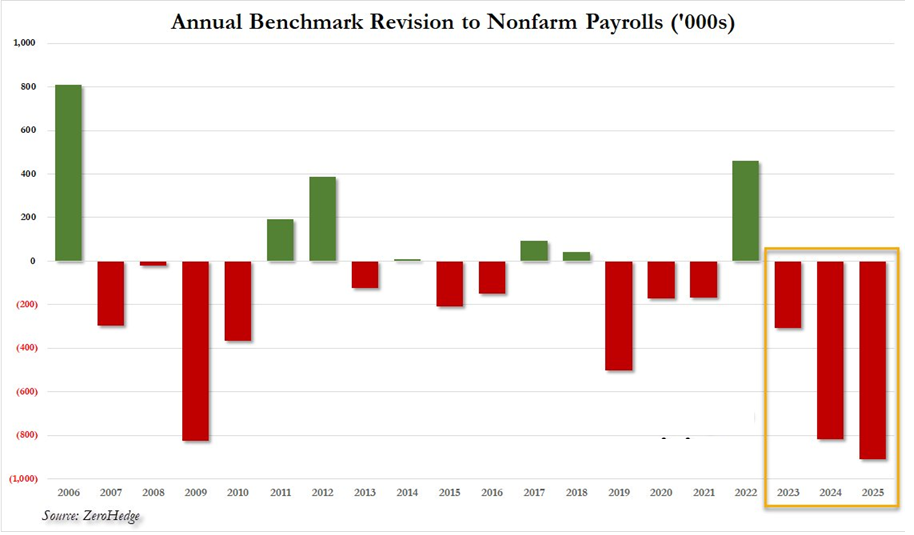
The scale of this overestimation allowed the government to present a stronger economy than it actually was, boosting market sentiment and fueling the spectacular rise in stock market indices.
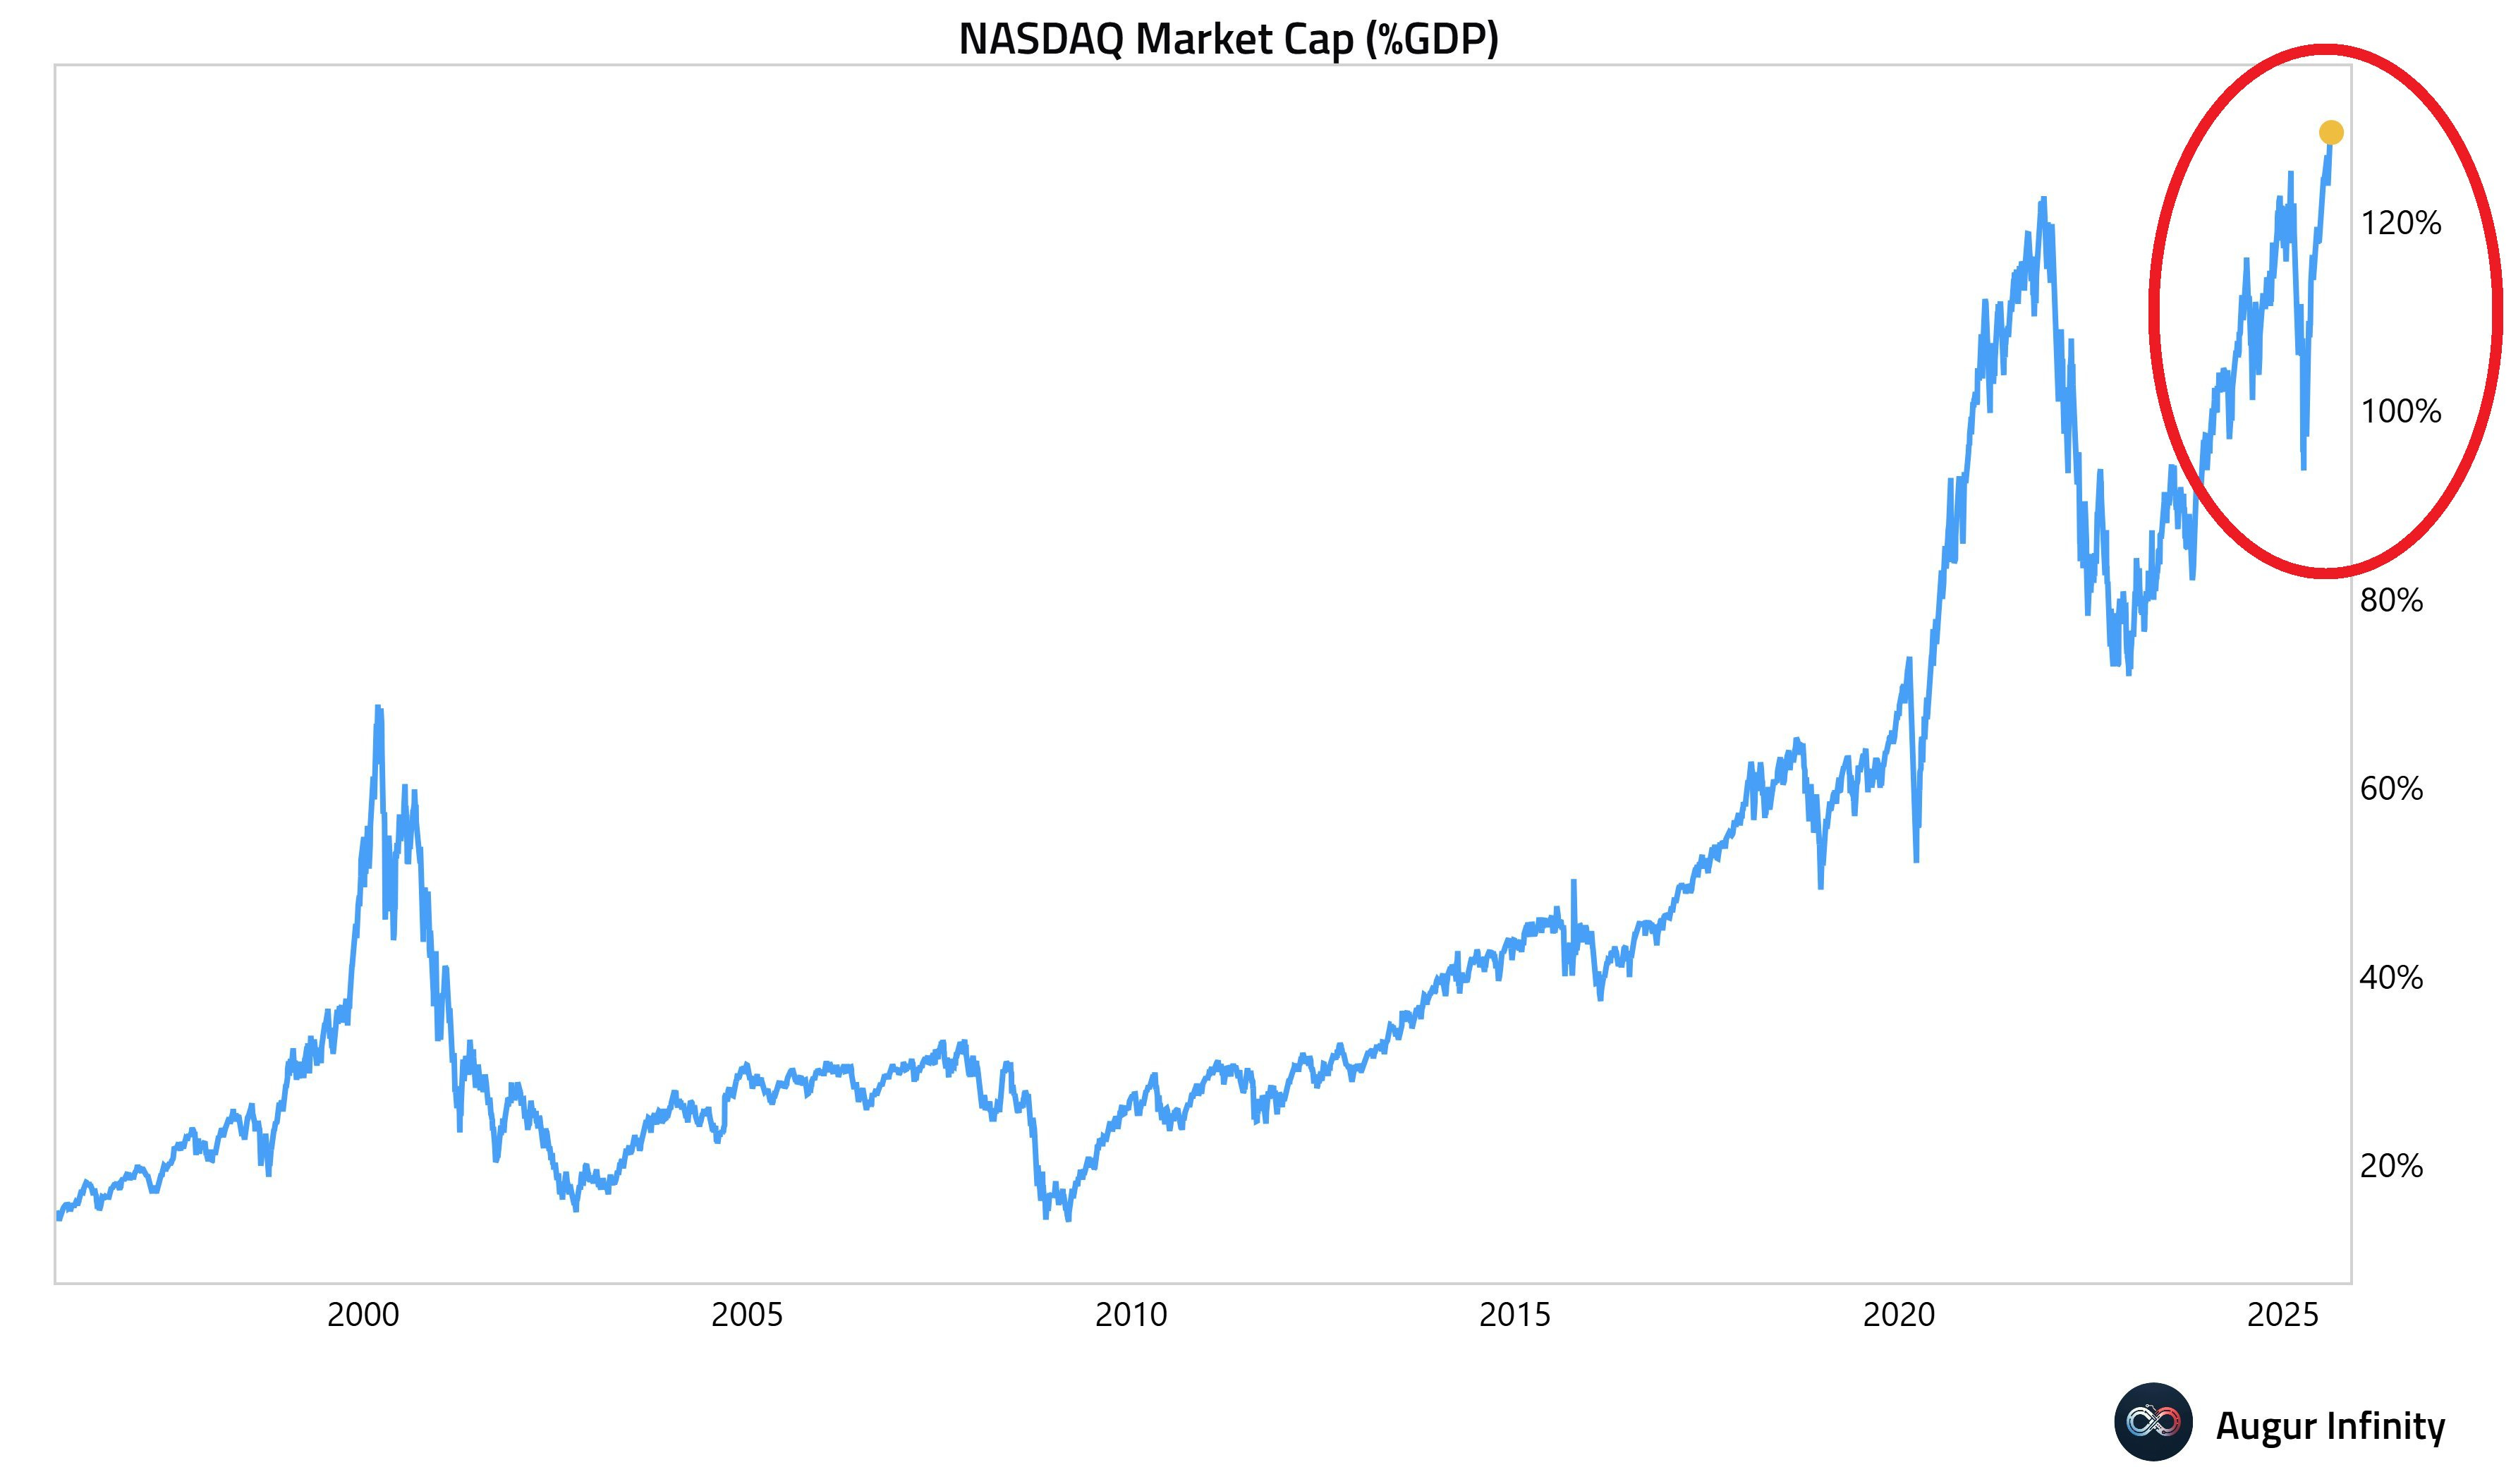
This statistical manipulation had very real effects: retail investors invested at historic levels, betting heavily on tech giants. Since January, individuals have injected nearly $50 billion into the “Magnificent 7” and Palantir — including $20 billion into Nvidia alone. This unprecedented frenzy has propelled the Nasdaq to more than 120% of US GDP, an all-time high, far exceeding the excesses of the internet bubble and the peaks of 2021.
While Wall Street breaks record after record — the S&P 500 and Nasdaq have posted historic closes — the real message coming from the labor market is that a recession is already underway. Over the last four months, the US economy has shed 142,200 jobs outside the healthcare sector — a level historically seen only at the onset of major crises. For the first time since April 2021, the number of unemployed (7.38 million) exceeds the number of job openings (7.12 million). Job creation is slowing, job loss announcements have already reached 892,362 in 2025, and even the public sector, which usually acts as a stabilizer, is contracting: federal employment has fallen by 90,000 jobs in eight months, the fastest decline in nearly 70 years.
The contrast is striking: a labor market in hidden recession, contrasted with financial markets in a state of euphoria, fueled by massive retail flows and structural complacency.
Goldman Sachs recently warned that it will be difficult for Nvidia to continue to outperform in the absence of new tangible catalysts. In other words, the rise is increasingly fueled by the narrative around AI and retail liquidity, rather than solid fundamentals. Even the Fed, which relied on overestimated figures for two years, now appears to be lagging behind in its mission to protect jobs, having tightened for too long in the mistaken belief that the labor market remained robust.
Against this backdrop, gold is sending a powerful signal.
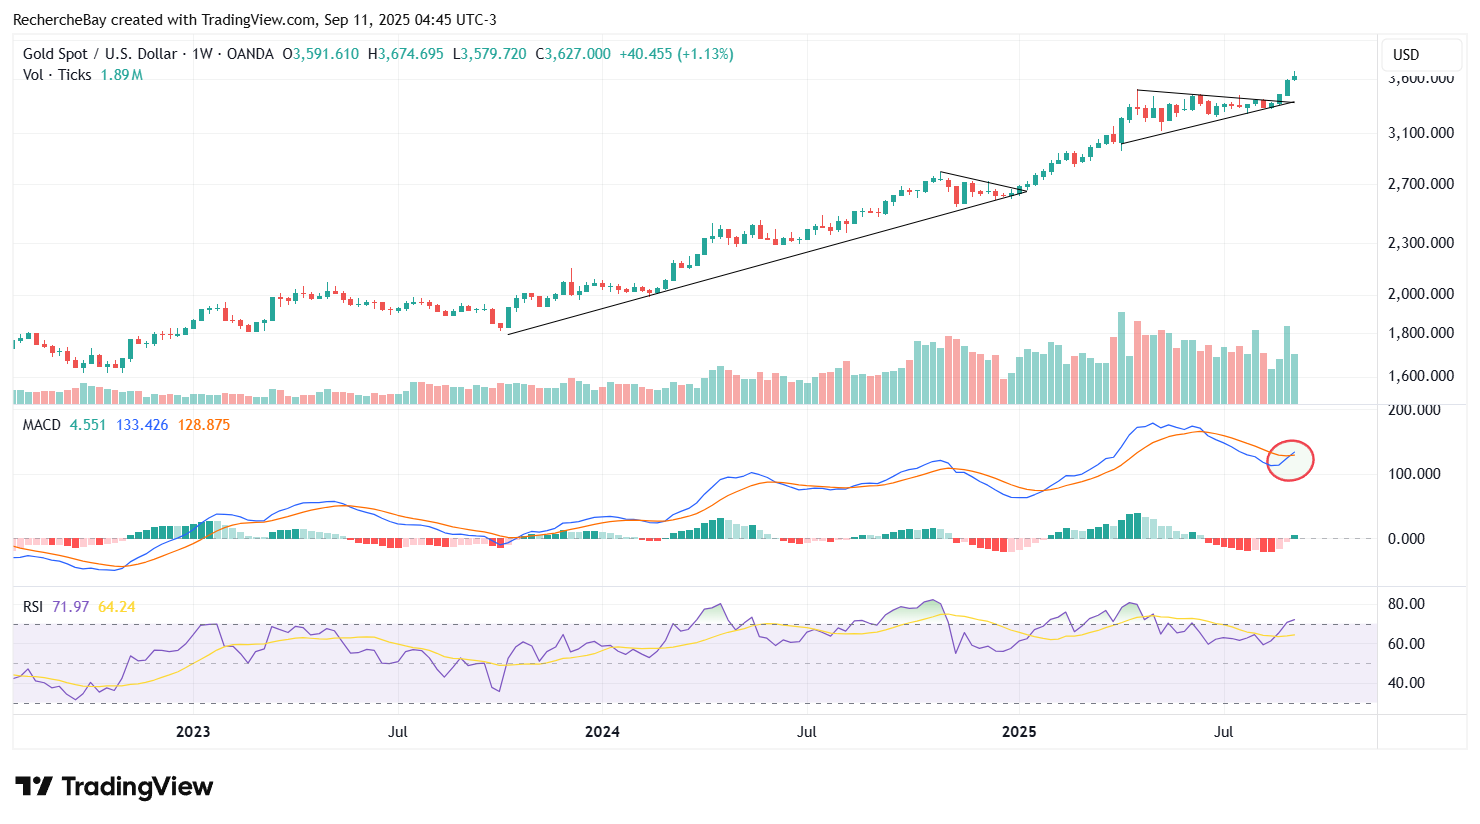
The metal has broken a new all-time record at nearly $3,700 per ounce, even though gold ETF holdings (GLD and similar funds) have not yet really picked up again: they are stagnating at around 94 million ounces, a far cry from the massive inflows seen in 2020 or 2022.
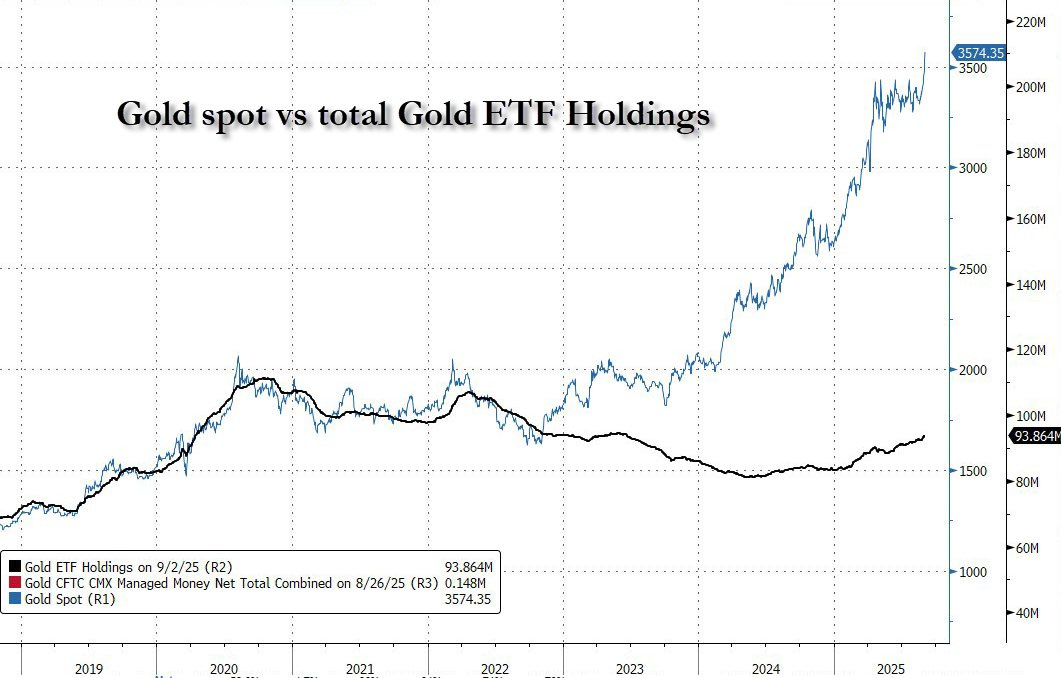
This dissociation shows that the current rise in the price of gold is being driven by other structural forces — central banks, Asian flows, physical purchases — and that there is still potential for a catch-up. If the Fed were forced to cut rates in a weak environment, as history suggests, the strong return of ETF flows would amplify the upward trend already underway.
The macroeconomic implication is clear: the trajectory is shifting toward cyclical disinflation, which could degenerate into deflation if job losses accelerate. In such a scenario, the Fed would have no choice but to ease its policy “in weakness,” as it did in 2008. And it is precisely in this type of environment — marked by disinflation, sluggish growth, and loss of confidence in official data — that gold regains its role as a hedge, regardless of the inflation regime.
Reproduction, in whole or in part, is authorized as long as it includes all the text hyperlinks and a link back to the original source.
The information contained in this article is for information purposes only and does not constitute investment advice or a recommendation to buy or sell.


