By Lyn Alden
In my view, there’s still a good case for including gold and gold stocks in a portfolio, despite their recent period of outperformance.
In other words, I still think we’re in the first half of this gold bull move from 2015/2016 lows, rather than the tail end.
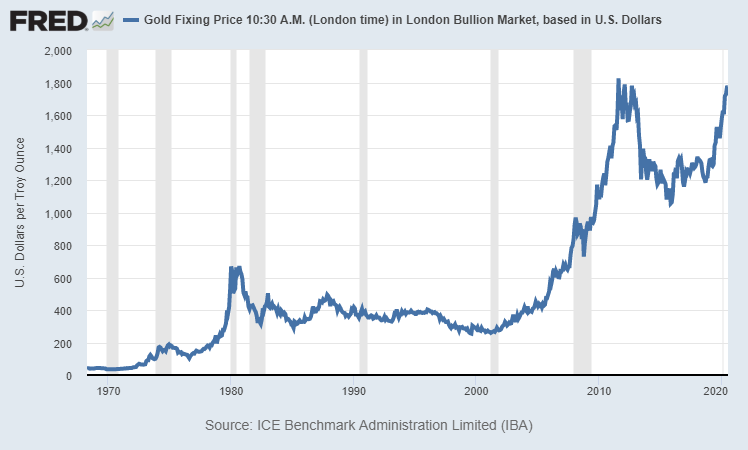
Chart Source: St. Louis Fed
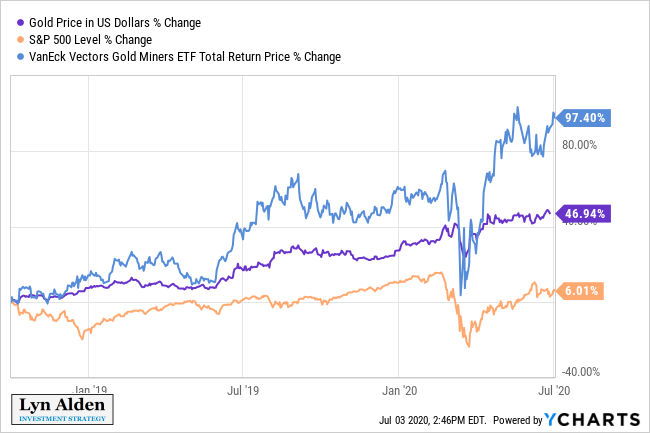
I added gold and gold stocks to my model newsletter portfolio in October 2018, and have dollar-cost averaged in from then until the present day. In the year and a half or more since then, gold and gold stocks have outperformed.
Should contrarian investors get concerned? Should we pivot away from gold now?
In my opinion, no. I still think this rally has legs, and remains an attractive risk/reward addition to a diversified portfolio. It’ll rise and fall of course, but my base case continues to view gold as being in a healthy upward trend. I’m still happy to buy gold at current prices, even though they’re not as good as prices that I bought at back in 2018 and 2019.
Here are four reasons why I remain bullish on gold in the intermediate and long term.
1) Money Supply is Expanding Quickly
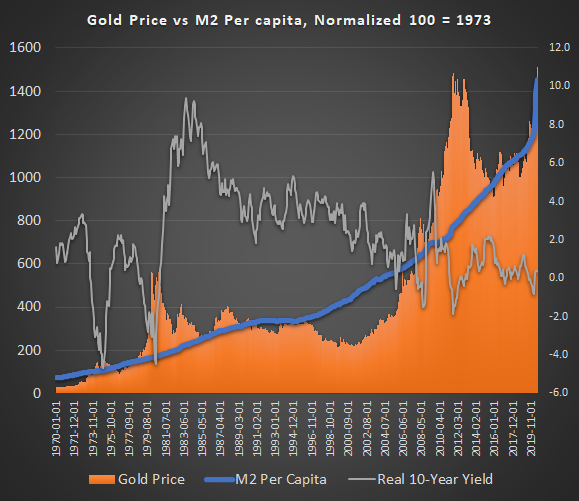
As long-term readers know, one of my favorite charts for gold is to compare the price of gold to the growth of broad money supply per capita. This works for any major currency, and I happen to track it in U.S. dollars, which is perhaps the best comparison because both gold and the dollar are traded worldwide.
The idea behind this ratio is that, over time, currencies inflate and devalue vs gold at various rates, while gold holds its purchasing power over the long term. And the speed with which currencies lose value is significantly tied to their money supply growth rate, especially when central banks print more and more currency to finance government deficits.
The reason I like to compare it per capita, is because the supply of above-ground gold grows at 1% or a little more per year, which is similar to the global population growth rate, and similar to the U.S. population growth rate. According to the World Gold Council, there are about 200,000 tonnes of mined gold known to exist, which equals roughly 7 billion ounces. There also happens to be 7-8 billion people in the world, or just under 1 ounce of gold per person.
In other words, decades ago there was about one once of gold per person above ground, and today there is still about one ounce of gold per person above ground. The ratio of how much gold there is per person is a relatively static figure. And yet, the global supply of currency per capita, and particularly the U.S. supply of currency per capita (for gold in dollar terms measurement), keeps increasing. Over the long run, the price of gold tends to keep up with this rate of monetary inflation, with occasional overshoots or undershoots.
By default, I like to normalize it to 100 in 1973 or 1995, and track the relative growth from there, which result in roughly the same number regardless of which of those two dates are chosen. I choose 1973 because that was shortly after gold was decoupled from the dollar, and therefore gave the market time to adjust gold to a reasonable price. And I choose 1995 because it was a perfectly boring time, without crises, housing bubbles, stock bubbles, excessive money-printing, and so forth.
So, those dates represent my baseline assumption for what gold “should” be worth against the dollar in a normal environment as a back-of-the-envelope thought experiment, and then I track the price growth of gold and the inflation growth of the money supply from those dates.
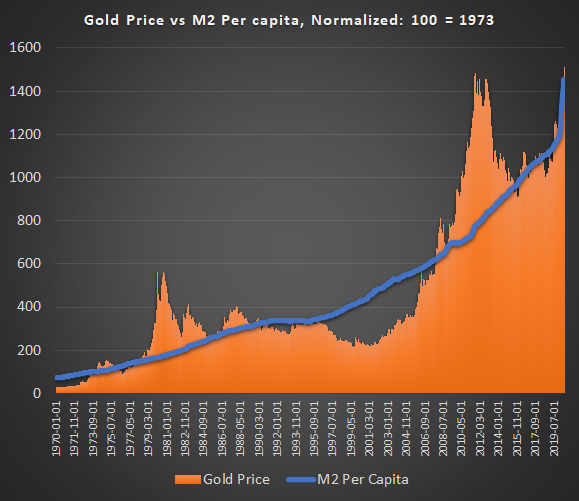
In simple terms, whenever the orange area (gold price, normalized to 100 in 1973) goes way above the blue line (broad money supply per capita, normalized to 100 in 1973), I’d be more cautious. Right now, they’re at about the same level.
This inclusion of per-capita metrics makes this my more conservative gold valuation indicator. In other words, it can certainly go a lot higher, especially during some type of currency reset or crisis, but this represents my lower-end base-case estimate of fair value in non-extreme circumstances.
By this metric, gold is fairly-valued. However, considering that I expect the broad money supply to continue to increase rapidly over the next several years, I err on the side of gold bullishness. In a world of very highly-valued stocks and very low-yielding bonds, I remain quite bullish on gold, and its other precious metal cousins like silver. The gold price tends to go above-trend during periods of negative real interest rates, and tends to go below-trend during periods of strongly positive real interest rates. We’re currently in the former environment; low or negative real rates for likely quite a while.
I had a similar view of gold in my February 2019 Seeking Alpha article:
"Right now, gold is fairly valued against the broad money supply per capita compared to how it was in 1995 or in the mid-1970s. Its current value has not dramatically outpaced money supply per capita like it did in 1980 and 2011, nor is it trending below the growth of money supply per capita like it did in the early 2000s.
Given that we seem to be perpetually in a low real interest rate environment for much of the developed world going forward (the existing high debt levels can’t support higher interest rates at this point), and gold is at a balanced price relative to money supply per capita, gold appears to be a reasonably good investment that should continue to appreciate in the long term, even if it, of course, has various dips along the way."
Since that article, broad money supply went up dramatically, and the price of gold went up dramatically. And yet, the ratio is still about the same. And I expect the money supply to continue to go up dramatically in the years ahead.
Some intrepid investors may wish to do similar comparisons with broader currency sets. One idea is to take the broad basket of currencies in the IMF’s SDR, for example, and look at total money supply growth per capita in that combined set and compare it to the gold price, normalized to whichever dates you prefer.
If we wish to remove the per-capita component, we can look at how much of a given currency is “gold backed”. Even though currencies aren’t formally backed by gold any more, most central banks still hold gold. Some central banks aren’t buying any more, like the United States, while others continue to buy aggressively when they can, such as Russia.
The United States formally claims to hold about 261.5 million ounces of gold, with over half of it being in the famous Fort Knox, Kentucky, and the rest in New York and Colorado. As of the end of June, these reserves were worth over $450 billion at today’s gold prices. Although they haven’t bought more for decades, the price of their reserves has been increasing due to the rising gold price:
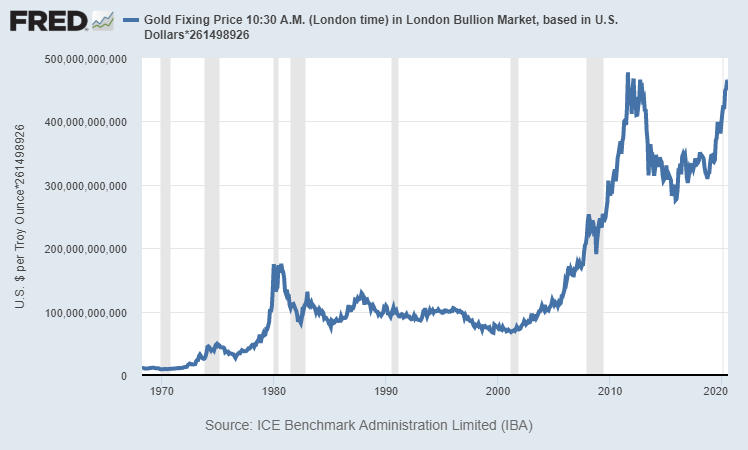
Chart Source: St. Louis Fed
However, this pales in comparison to the $18.4 trillion in broad U.S. money supply.
This next chart shows the current price of official U.S. gold reserves divided by the broad money supply. In other words, it measures what percentage of broad money supply is “gold backed”. There is no per-capita adjustment in this chart; just a representation of how much official gold the United States has compared to the broad money supply in the United States:
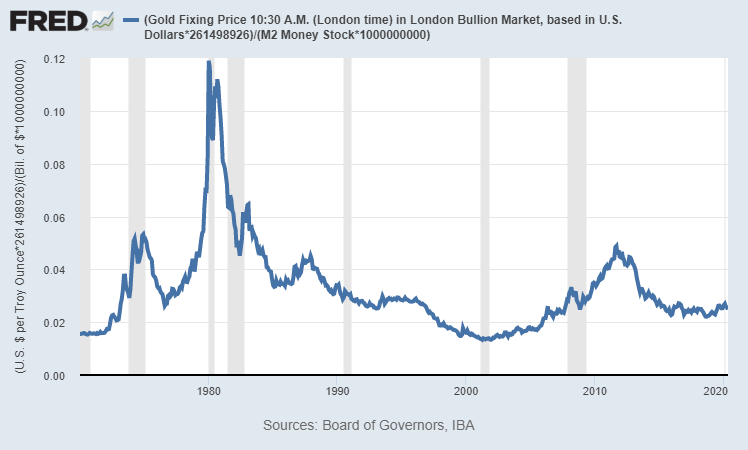
Chart Source: St. Louis Fed
Currently, this ratio is below 2.5%. The value of official U.S. gold reserves is worth less than 2.5% of U.S. broad money supply.
The only times it dipped below 2% were in the early 1970’s and the late 1990’s. Both of those times were the start of outrageously long and profitable gold bull markets. In the early 1970’s, the gold peg to the dollar was broken, and the price of gold was allowed to float freely, and rose dramatically in price in the inflationary 1970’s. And then again in the early 2000’s, during a commodity bear market at the peak of the Dotcom tech stock bubble, gold started a bull market and went on to soar in price for the next decade as stocks performed poorly.
The ratio would be even lower today if we include the offshore dollar market, since the U.S. currency has a sizable percentage that is held abroad and thus not counted in the official broad money supply metric within U.S. banks.
Am I happy to buy gold with U.S. dollars at the moment? Sure. Do I think gold is overvalued? Not really. I’d argue it is fairly-valued by my conservative models, and somewhat undervalued by my more aggressive models, such as this simple chart of how much of its money supply the U.S. could theoretically back with its official reserves based on current prices.
For comparison purposes, out of all major currencies at the moment, Russia actually has the highest official gold-backed ratio. In other words, the value of their official gold reserves compared to their broad money supply is quite high by comparative standards. They have a little over 81 million ounces of gold reserves, worth $144 billion USD. Meanwhile, their broad money supply is about 53 trillion rubles, which translates into $750 billion USD. Therefore, Russia’s gold-to-M2 ratio is a sizable 19%, compared to the United States’ ratio at under 2.5%.
If gold has a real “bull move” such that this ratio of gold reserve value to broad money supplies goes to 4-5% like in 2011, at a time when broad money supply is rapidly increasing, that is a recipe for $4,000+ gold prices per ounce.
I’m not saying that will happen, but I’m saying that we’re closer to the bottom end of the 50-year range here, rather than the top half of the range, in terms of U.S. gold reserve value relative to U.S. broad money supply.
2) Real Interest Rates are Low/Negative
The price of gold in year-over-year percent change terms tends to inversely correlate strongly with real interest rates, as measured by the 10-year Treasury yield minus the official inflation rate.
The blue line in the chart below is the real (inflation-adjusted) 10-year Treasury interest rate, and the red line is the year-over-year percent change in the gold price:
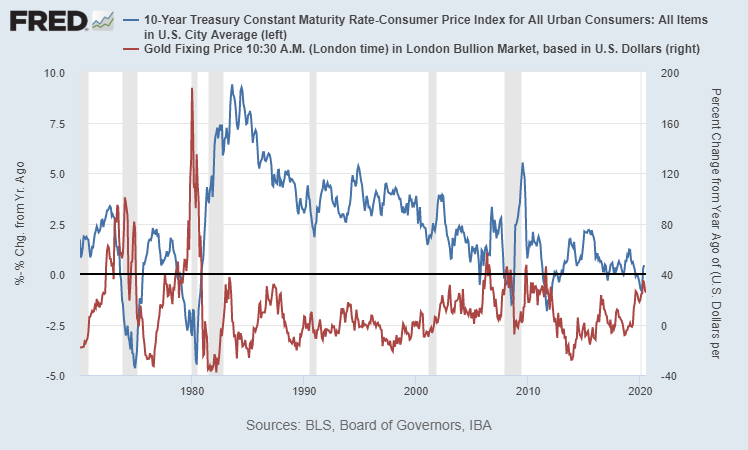
Chart Source: St. Louis Fed
Many people think gold is tied to inflation, but that’s not quite the case. For example, inflation was still high in the 1980’s, but the gold price plummeted. Instead, changes in the price of gold are closely related to changes in real interest rates.
Suppose, for example, that inflation is high at 5% per year, but 10-year Treasury yields pay you 8% per year. Your real rate of return for holding Treasuries is therefore 3% per year. These numbers seem extreme today, but this was the case in the 1980’s. Those numbers represent a good environment to hold Treasuries instead of gold, because you get paid a real rate of return for holding Treasuries while gold pays you nothing, and has storage costs. The opportunity cost for holding gold in that sort of environment is high, and is why the gold price performed terribly in the 1980’s and 1990’s in dollar terms.
Now suppose instead that inflation is 2%, but 10-year Treasury yields are 1%. You lose 1% per year in purchasing power by holding Treasuries. Even though inflation is low, bond yields (and bank account yields) are even lower. The case for holding gold is high in this case; it’s a scarce asset with no counter party risk that holds its purchasing power over the long run, and is competing with Treasuries and bank accounts around the world in multiple currencies that pay negative real yields. I’ll take gold, thanks. And many investors do as well, which is why gold tends to get bid up in price when real yields decrease or are expected to decrease.
Of course, the best case for gold would be high inflation plus low nominal yields, because that would mean sharply negative yields. For example, if we get a spike to 7% inflation while Treasury yields are 1%, that would be -6% real yields, which would like trigger a hefty spike in the gold price. But ultimately, at inflation scenario is still about the rate of change of real yields.
In fact, if we look at that previous gold-vs-M2-per-capita chart again, but add the inflation-adjusted interest rate of the 10-year U.S. Treasury to the chart on the right axis, we can see that those spikes in the gold price above the trend line happened during plunges to low real interest rates:
We’re likely to be in a negative-real-yield environment for a while. In the latest FOMC meeting minutes, for example, Fed officials had a lengthy discussion on how to implement yield curve caps, which means buying Treasuries as needed to maintain low Treasury yields, like they did in the 1940’s (the only other time that federal debt as a percentage of GDP got this high).
I’m long gold in part because I expect bank yields and Treasury yields to pay interest rates that are below the prevailing inflation rate for a while. Of course, during deflationary shocks we can get a quarter or two with very low inflation, but the Fed’s inflation target is 2% per year, and they have stated a willingness to print money and buy assets, along with supporting fiscal spending, to achieve those targets or even overshoot those targets, while the 10-year Treasury yield is less than 0.70% today.
Traders can still make a lot of money by trading Treasuries based on swings in interest rates, but for long-term money, I still prefer gold here.
3) Momentum is Strong for Gold vs Stocks
The S&P 500 has had a wild chart lately, and in part is held up by the Fed stimulating asset prices by injecting all sorts of liquidity:
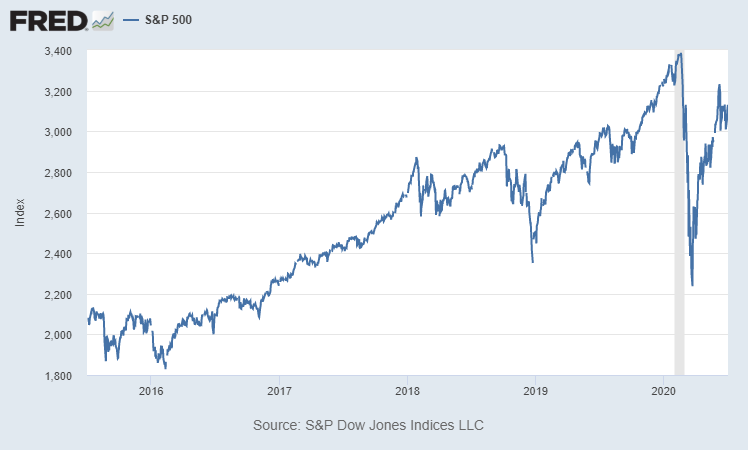
Chart Source: St. Louis Fed
However, if we measure the S&P 500 as priced in gold, it peaked back in 2018 (the same time that the U.S. GDP growth rate peaked), and has been making lower lows and lower highs ever since:
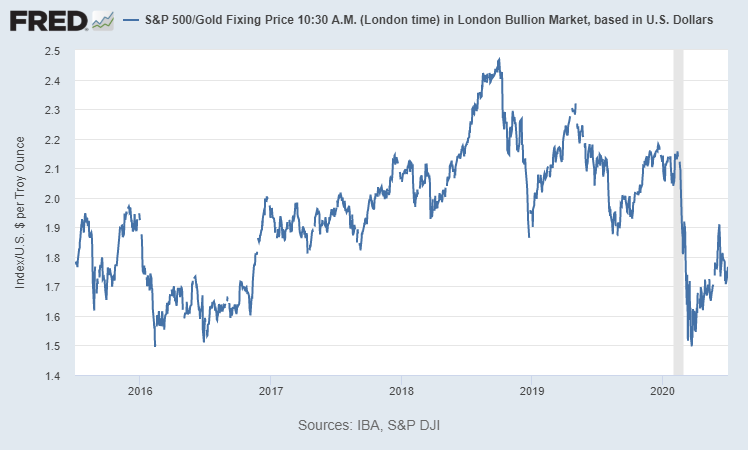
Chart Source: St. Louis Fed
Let’s take a similar metric, and zoom out over the long term. Going back more than a century, the Dow Jones Industrial Average has gone up dramatically as priced in dollars:
Dow Jones Industrial Average: Priced in Dollars
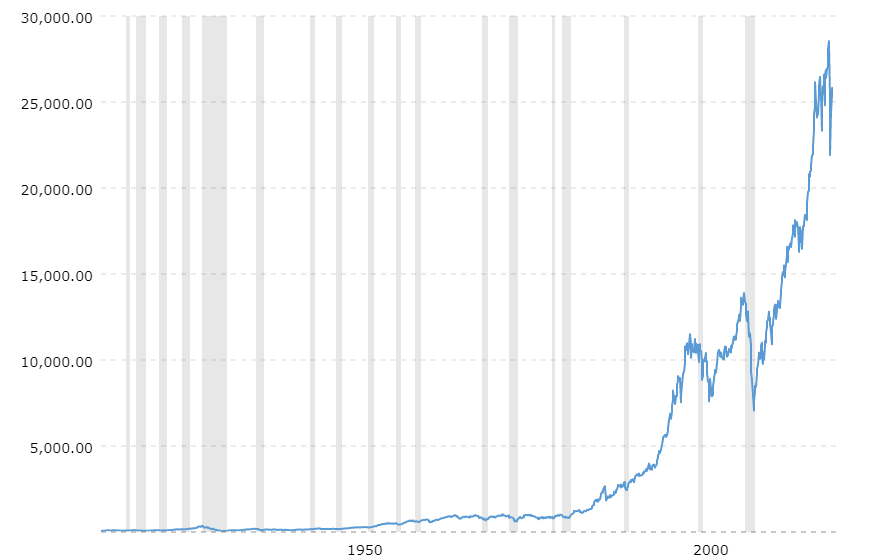
Chart Source: MacroTrends.net
But as priced in gold, the Dow actually just goes up and down, and the extra return that it provides vs gold over the very long run mainly comes from the dividends it pays out over time.
Dow Jones Industrial Average: Priced in Gold
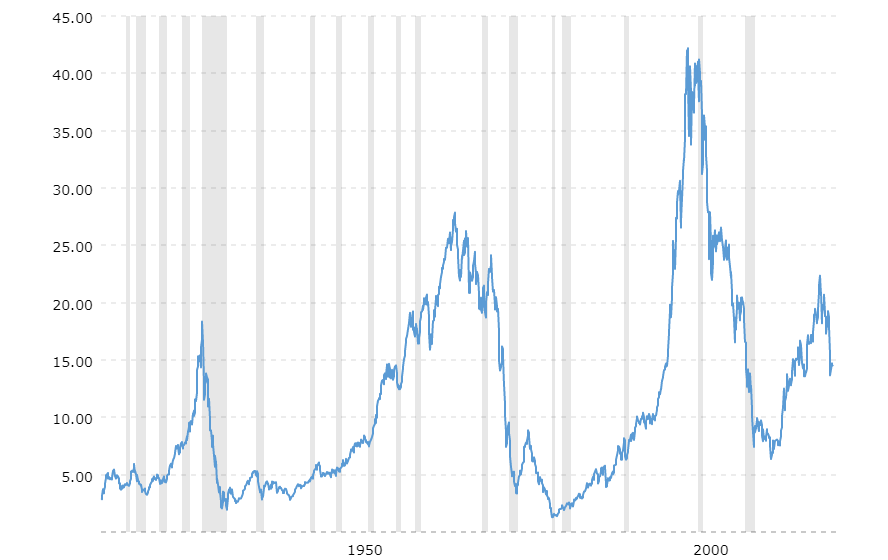
Chart Source: MacroTrends.net
With high stock valuations at the present time, and relatively low-or-moderate gold valuations, I think there is plenty of room for the Dow-to-gold ratio to decline in the years ahead, meaning that gold can continue to outpeform the Dow (and S&P 500).
If we flip it around, a metric I’ve been following for a while is the gold-to-S&P 500 ratio. When it goes up, it means gold is outperforming stocks. When it is going down, it means stocks are outperforming gold. For the first time since 2001, the gold-to-S&P 500 ratio broke above its 50-month moving average:
Gold to S&P 500 Ratio
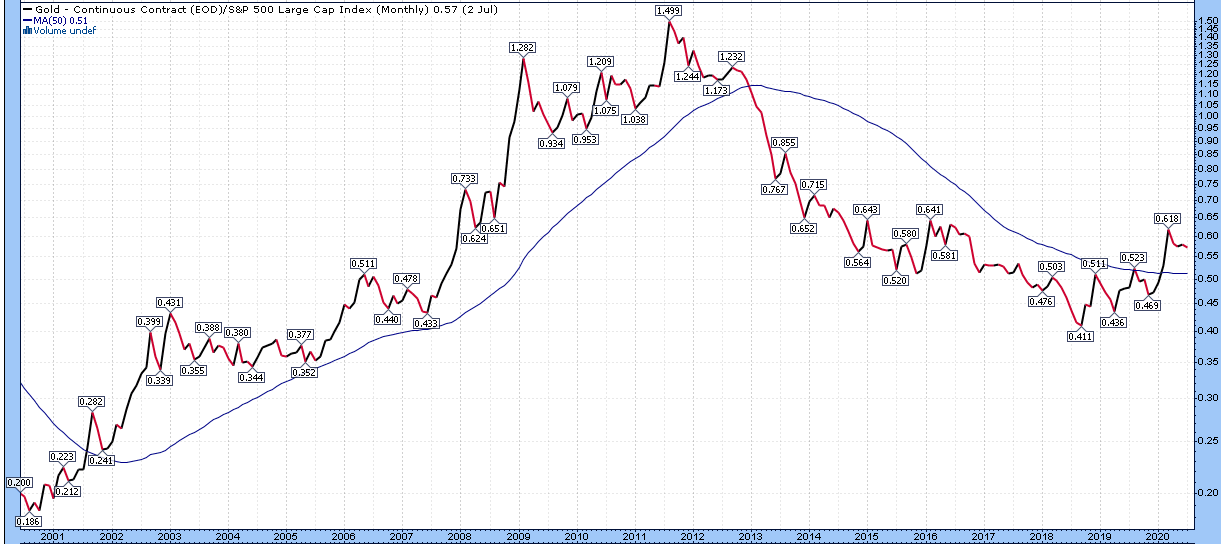
Chart Source: StockCharts.com
In 2001, when the gold-to-S&P 500 ratio broke above its 50-month moving average, it was the start of a massive bull run in gold. And then when the ratio broke below the 50-month moving average in 2012, it was the start of a very long bear market for gold, and a great period for the S&P 500. History may or may not repeat, but we do have a nice breakout again. The ratio bottomed in 2018, and broke out strongly in 2020.
Given my expectations for a more inflationary 2020’s decade than the 2010’s decade (and yet with interest rate capped by the Fed, resulting in negative real yields for a while), and given the other metrics described here, I’m happy to keep gold as part of my diversified portfolio, and expect it to have good risk-adjusted return potential.
4) Gold Remains Under-Owned
Those of us that care about gold and consider it an asset class to invest in may feel that gold is already overbought, over-owned, with too much enthusiasm.
At best, this remains the case among niche investors; the minority that actually own gold. We look at our peers and see plenty of bullishness for gold, and thus get concerned that perhaps gold is overbought.
However, among the broad investment community, virtually nobody owns gold in meaningful amounts, if at all. Pensions don’t own gold. 401(k) plans don’t own gold. Insurance company portfolios don’t own gold. The classic 60/40 stock/bond portfolio doesn’t own gold. Global equities represent $90 trillion in wealth. According to the 2019 Credit Suisse wealth report, global net worth is $360 trillion. According to the World Gold Council, with less than 200,000 tons of gold known to exist, and at current prices, that is about $12 trillion worth of gold. The portion held by private investors is well under $10 trillion. Gold is an afterthought.
Even among investors that own a sliver of a gold ETF in their portfolio, most of them haven’t actually touched a gold bar or coin. The desire or need to own gold for investment purposes has been nonexistent in most countries for the past four decades. In the 1970’s, gold reached a much higher share of assets than it has now.
To be clear, I’m happy to sell gold if I determine that it has become overvalued.
I collected my first gold and silver coins in the late 1990’s as a kid, and still remember standing in a coin shop selling them in 2011 as a young 20-something, luckily near the cycle peak, because I was concerned about how far they went up in price and how much mainstream enthusiasm there was about gold and silver at the time.
This period, in terms of sentiment for gold, resembles nothing like 2011. Quantitatively and qualitatively, it still seems comparable to late 2009, when gold was rising but not yet overpriced.
Since I added gold and gold stocks to my model newsletter portfolio, for example, we have had four notable corrections, with the March 2020 correction being particularly large:
These pullbacks are healthy.
I get emails all the time from people wondering, “I’m interested in gold, but don’t you think it might pull back again like it did in March, if there is another liquidity event?” This is a healthy question; it’s a sign of skittish investors, including ones that were burned by the peak in gold in 2011 and subsequent bear market. This is not a euphoric, over-enthused, set of gold investors. Gold is slowly climbing that wall of worry and isn’t even at all-time nominal highs.
And my answer to those sorts of questions is, “of course”. We’ll certainly have various dips and pullbacks along the way. Will those dips occur from current levels, and create a better buying opportunity, or will gold rise first, and then dip to levels that are still above today’s prices? I don’t know.
March 2020 was kind of unique among the recent corrections, because it was a sharp liquidity crunch and margin call at the beginning of a recession, like in 2001 and 2008, the start of the previous two recessions. However, gold tends to do very well in later portions of recessions, when the liquidity event is over, but the solvency problems are in full swing, combined with aggressive stimulus by the government to offset those issues. That’s the phase we’re in now.
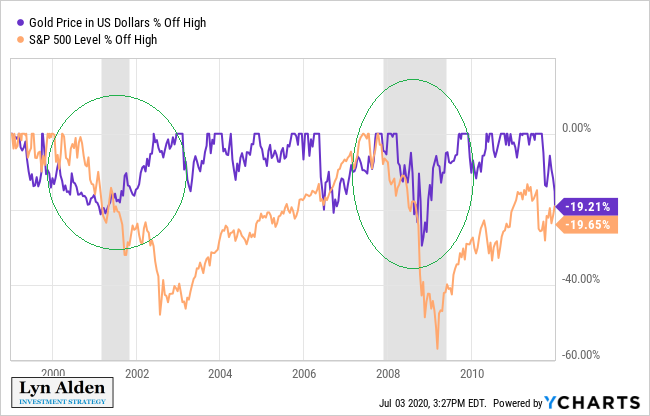
Here’s a chart of gold and S&P 500 price declines from highs in the previous two recessions, which are shaded in gray:
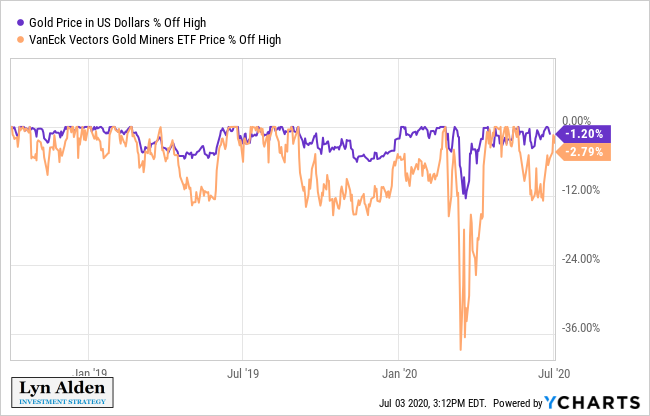
And here was the similar liquidity event during the early stages of the 2020 recession:
Could we have another liquidity-driven sell-off for gold later in 2020 or 2021? Sure, perhaps. But I’m not going to bet we will; I’d rather own gold, and then buy more on dips if it comes to that. I bought more gold in mid-March 2020 during the dip by selling some T-bills on hand, and would be happy to do so again if we get another one of those events. It’s always nice to have some cash-equivalents for that sort of scenario.
But I’m not necessarily waiting for another one of those events. We had the liquidity crunch at the start of this recession, just like the previous two recessions, so I have little reason to assume we’ll get another big one, even though we’ll naturally get some corrections along the way. Whenever we get them, big or small, I’m happy to accumulate more, because the price remains reasonable in my view.
When gold ETFs and gold stocks are all over the Robinhood top 25 holdings list, and when generalist retail investors are highly interested in buying gold and gold stocks, and when my models suggest gold is overpriced, and when they can’t stop talking about gold everyday on CNBC, that’s when I’d be interested in selling.
Until then, I’m happy to dollar-cost average into gold as part of a diversified portfolio, and consider the metal to have plenty of positive catalysts over the next few years.
That doesn’t mean I want to chase it at any price, though. When it goes up too far too fast, it makes sense to ease purchases a bit or even trim a little, and if it has a sizable correction, it makes sense to accumulate more, in my view.
In addition to gold, I remain even more bullish on silver and some of the more volatile metals during the 2020’s decade.
Reproduction, in whole or in part, is authorized as long as it includes all the text hyperlinks and a link back to the original source.
The information contained in this article is for information purposes only and does not constitute investment advice or a recommendation to buy or sell.


