China is the world's factory and largely dominates the photovoltaic panels market, an industry that consumes a lot of silver. From January to May 2024, 1,663 tonnes of silver were delivered to the Shanghai markets (SGE and SFE), and analysts expect 3,992 tonnes to be delivered during this year.
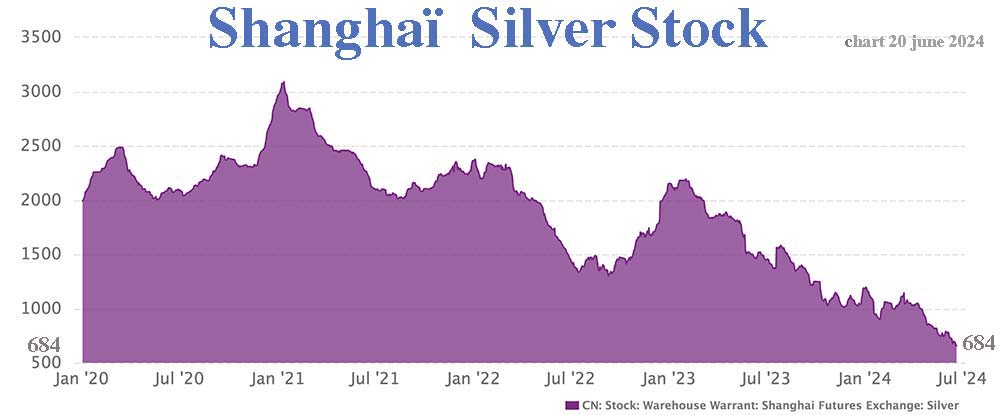
While SFE stocks stood at 3,200 tonnes in January 2021, they fell to 684 tonnes on June 20, 2024:
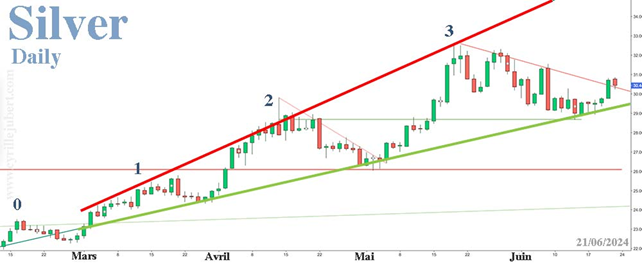
This strong industrial demand caused a rise in silver prices:
The SFE over-the-counter market is a physical market strictly reserved for industrial buyers and suppliers. Within the SFE, this OTC market facilitates the link between futures contracts and end-users.
The largest buyer in the silver-related industry is Lequing Industrial Park in Zhejiang, with an annual demand of 2,000 tons. Leqing Jinbang Co is responsible for supplying the metal and has a silver warehouse that supplies more than 600 companies. Xinhu Ruifeng Co, its own metal supplier, plays an active role in the OTC market as one of the main suppliers, while simultaneously hedging on SFE futures contracts.
The main trader on the SFE is called Zhongcai, he still occupies the first place in terms of long positions. In April, he sold his long positions when prices reached their highest level. Zhongcai maintains close ties with the companies mentioned above, which allows it to stay fully informed of the tense situation in the physical market. As a leading player and strategic investor, Zhongcai has positioned itself on the upside on Friday 14th, as silver prices returned to support both the 50-day Moving Average and the bullish oblique support. On the over-the-counter (OTC) market of the Shanghai Futures Exchange (SFE), the price of silver closed at $34.14 on Friday, June 21.
For at least 6 years, industrial demand has far exceeded mining production. The market is in constant deficit:
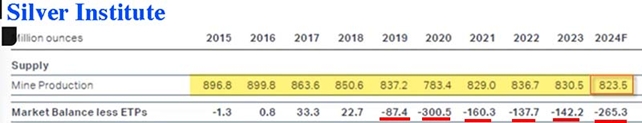
Having examined all the mining companies' balance sheets, project by project, it's obvious that the planned production will not be achieved this year. Silver mining production continues to decline and, in the best case scenario, it will remain at the current level from 2024 to 2030. Note that Mexico, the world's leading producer of silver, will have exhausted its underground reserves in two years, and China in 10 years.
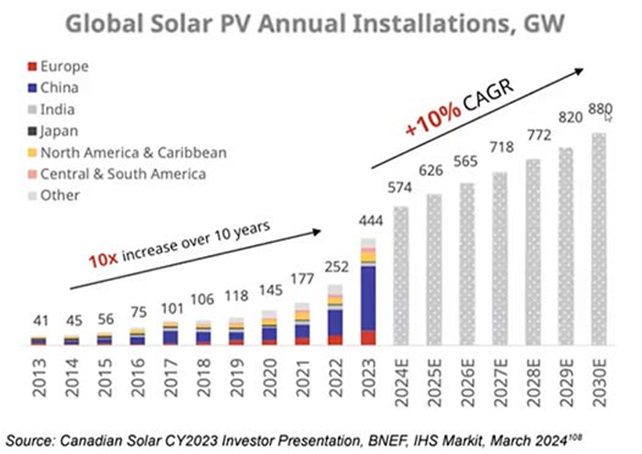
A Canadian study on photovoltaics (PV) shows that silver demand for PV has increased tenfold over the past 10 years. The study projects an annual increase of only 10% until 2030, but estimates that PV alone is expected to consume 880 million ounces (Moz) of silver in 2030. This means that the photovoltaic sector alone will consume MORE than all annual mining production! This comes at a time when the market has already been in deficit every year for the past 6 years:
SRSrocco considers that demand across all sectors should reach 1,550 Moz, generating a deficit of nearly 700 Moz, on top of the accumulated deficits of previous years. By adding the theoretical above-ground stocks in London, New York and Shanghai, it will be impossible to fill the deficits for 2025 and 2026. Prices will reach levels that most people cannot imagine.
This sharp rise in prices has already begun and will increase considerably in the very short term. Here is why and how.
Have you heard of Jesse Livermore?
Born in 1877, Jesse Livermore was one of the greatest traders of all time, although little known to the general public. His autobiography, “Reminiscences of a Stock Market Operator” (1923), written by Edwin Lefèvre, is considered essential reading for all traders.
At his peak in 1929, the author of "How to Trade in Stocks" (1940) was worth $100 million, which would be equivalent to about $1.5 billion today.
The accumulation cylinder
At a time when all charts were handed-drawn on graph paper, Livermore observed that stock price movements often reproduced a number of patterns.
The one that interests us begins with what Livermore called an “accumulation cylinder with widening mouth”:
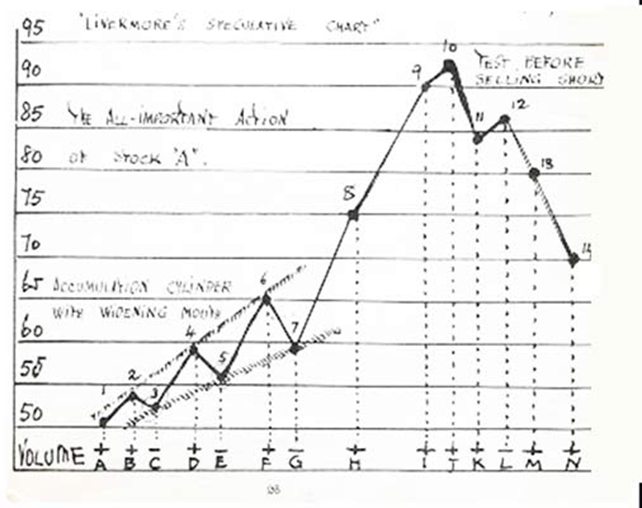
As we see on his chart, the fourth peak (named 8) has broken the resistance of the three previous peaks and will then lead to a double leg uptrend, leading to a peak.
We've been through this before, not so long ago. On the silver chart from 2009 to 2011, we find the accumulation phase and the powerful exit, which brought Silver to $50:
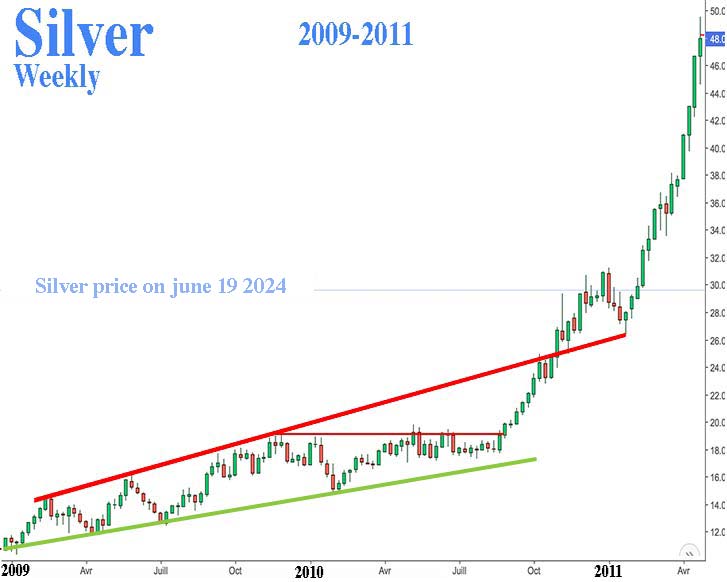
The big difference between 2009-2011 and today is the TIMING. From 2009 to 2010, there were three peaks within 12 months. Today there have been four peaks in just 4 months:
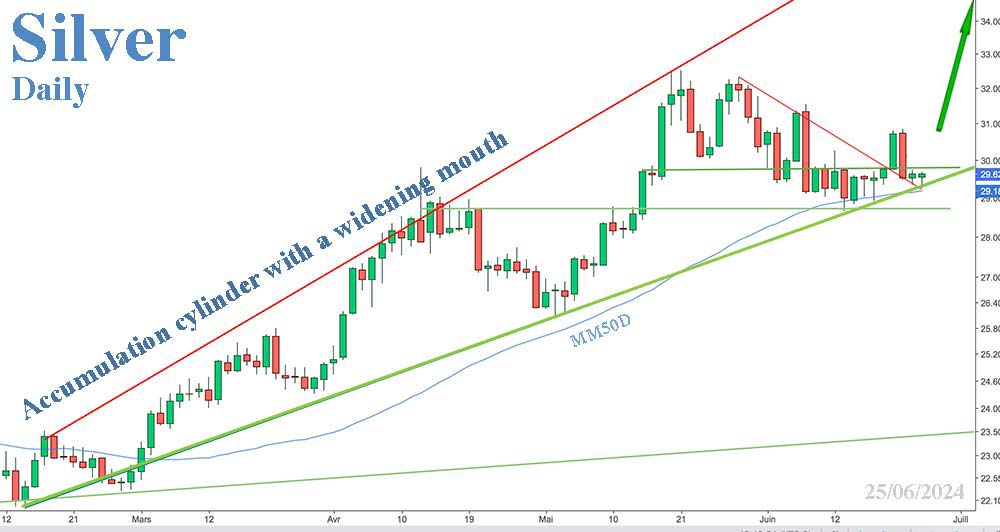
According to Chartist logic, the next high could be around $36 in the coming weeks.
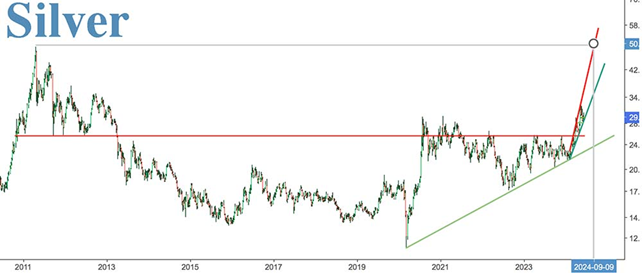
Whether or not the resistance is broken, prices could reach around September $50, their all-time high:
Don't forget that China, which is driving the silver market upwards, already closed at $36.52 on May 29. They are one cycle ahead of the West.
The premium in Shanghai compared to prices in London and New York fluctuates between 12 and 14%, encouraging Chinese traders to obtain supplies cheaply on the COMEX and the LBMA, which puts the Cartel in difficulty.
Silver prices should give us strong sensations until the end of the year.
Reproduction, in whole or in part, is authorized as long as it includes all the text hyperlinks and a link back to the original source.
The information contained in this article is for information purposes only and does not constitute investment advice or a recommendation to buy or sell.


