In "Pouvoir d’achat, le grand mensonge" (Purchasing power – the great lie), that I just published with Eyrolles, I speak out against the under-estimation of inflation, as measured by INSEE. The statistical agency minimizes the weight of real estate by inventing a “quality effect”, thus eroding the rising prices and being able to announce an increase in purchasing power year after year, although it doesn’t correspond at all to what the people are experiencing in their daily lives.
In order to go beyond this criticism and to understand recent history, I reconstituted the price history of the last decades (1965-2015), without using INSEE data, of course. For that purpose, I searched for real-time prices in shopping catalogues and commercial advertisements, and in databases as well, in order to cover all the different types of products (household appliances, clothing, food, automobiles, rent etc.). To interpret this data, one has to divide the price of a product by the monthly minimum wage at the time in order to determine how much work time is necessary to acquire said product. This method was used by Jean Fourastié, who used minimum wage as a benchmark for calculating a valid “real price” for the whole of the workforce.
Among all the products researched (from vacuum cleaners to automobiles, from a bottle of Ricard to the cost of rent), of course, I haven’t forgotten the price of gold, using the Napoleon, the most popular gold coin in France.
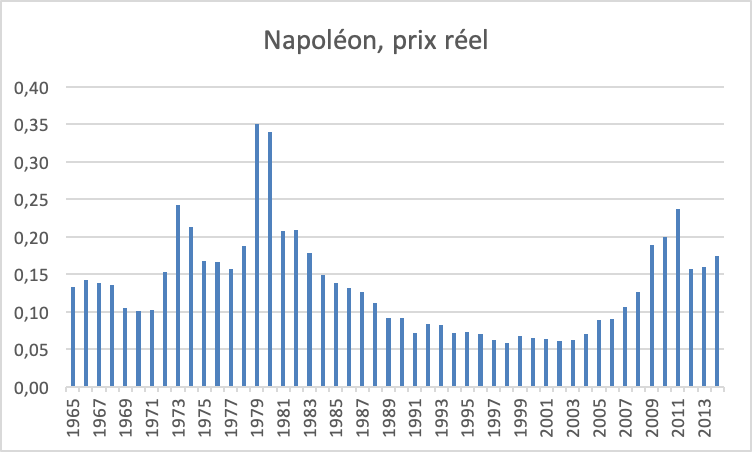
Prices are adjusted each year in June
In 1965, a Napoleon was equivalent to 13% of a monthly minimum wage net salary, and 17% in 2015, half a century later, which demonstrates remarkable stability. But during that time we have witnessed a strong rise in the ‘70s twice (1974 and 1980) and then a decline in the ‘80s and ‘90s, followed by a climb started in 2005 that peaked in 2011.
On August 15, 1971, Richard Nixon announced the end of the dollar’s convertibility into gold. This was followed, in Western countries, by a wave of inflation during all of the ‘70s. Those who own gold are doing better than just preserving their purchasing power – they increase it in a significant manner. Gold plays its role of protecting against inflation perfectly.
In 1979 and 1980 we witnessed an exaggerated increase followed by a total trend reversal, a real crash, and the same went for gold’s world market. What happened? The new chairman of the Federal Reserve, Paul Volker (nominated by Jimmy Carter in 1979 and confirmed by Ronald Reagan in 1983), wanted to kill inflation. He chose the hard way by raising interest rates on the dollar to 20% in 1980! This shock treatment worked, and inflation came back down to 3% in 1983. The price of gold reacted negatively.
This was followed by a slow decline until 2005. Contrary to the ‘70s, inflation has remained in check, at least officially, which is not surprising given that real estate is under-estimated, its bubble not being mentioned in the data. Those who own gold are doing better than protecting their purchasing power; they actually increase it, which helps “keeping up with” the rise in real estate prices. Disengagement remains limited in 2011, and the trend remains positive afterwards.
As we see clearly, gold does preserve purchasing power over long periods of time, and this purchasing power even increases in troubled periods (which shows that one must not wait for the crisis to buy gold...). This chart confirms that gold is an excellent investment and constitutes the best possible insurance over the long term.

Reproduction, in whole or in part, is authorized as long as it includes all the text hyperlinks and a link back to the original source.
The information contained in this article is for information purposes only and does not constitute investment advice or a recommendation to buy or sell.


