If you spend much time following precious metals analysis on X, you've likely noticed that there has been a lot of conversation lately about the gold/silver ratio and what it means for the future direction of both metals. As the ratio rises, Gold is outperforming Silver, and this generally is bad news for both metals. Conversely, a falling ratio generally means a tailwind for the price of both metals. This week, we'll look at a few charts of GSR to see if we can uncover some clues of our own.
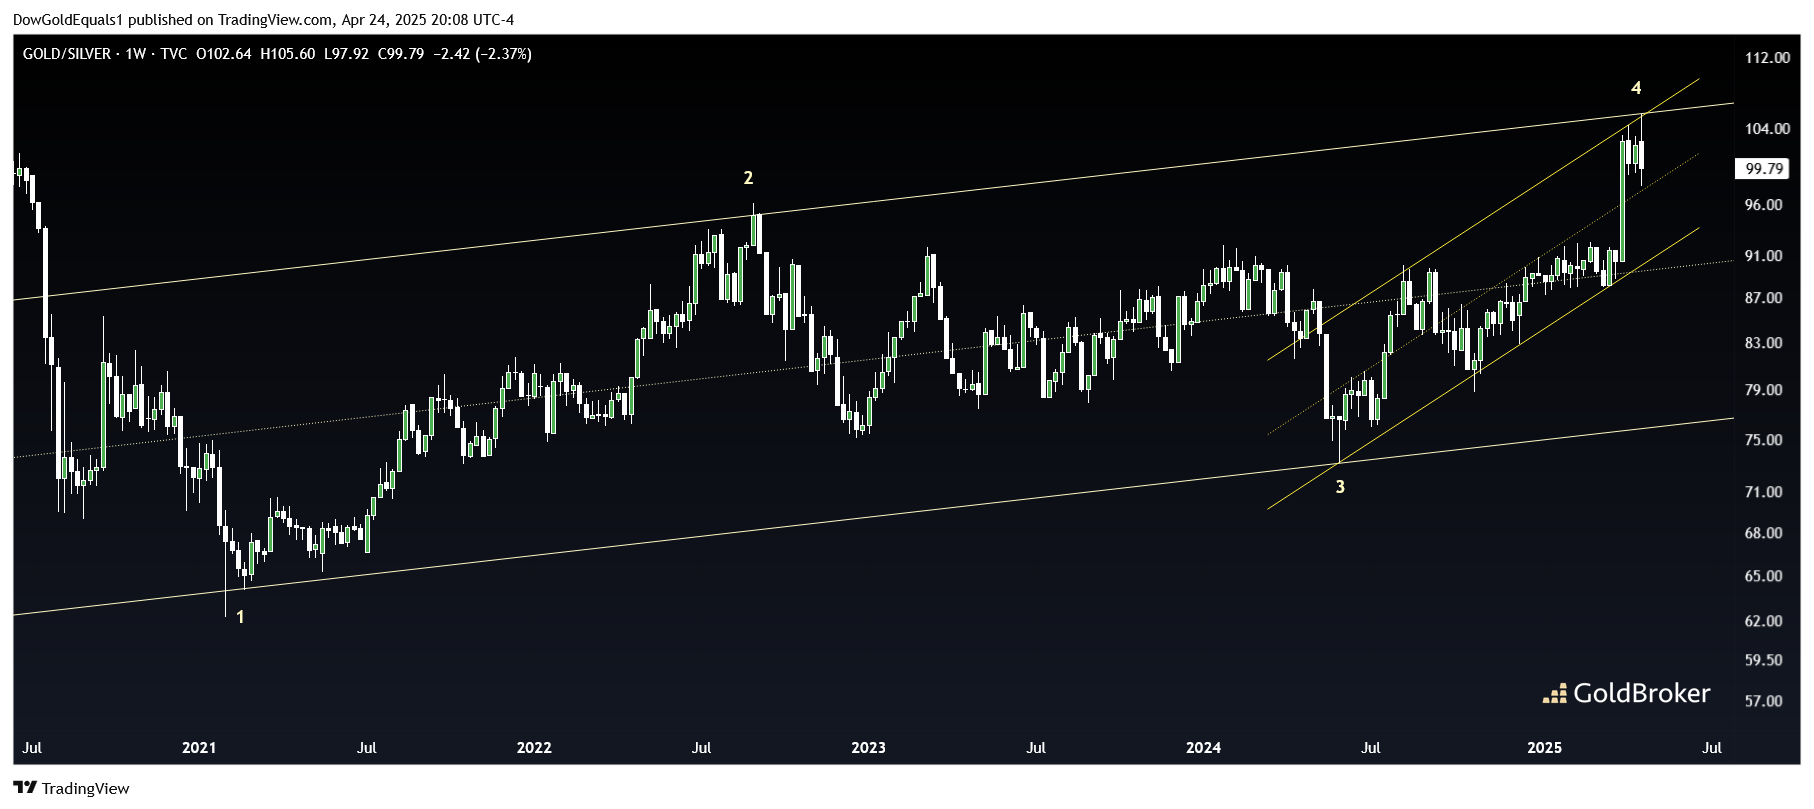
The first is a weekly chart that shows the ratio's value going back to 2021, where we can see a clear 4 point channel first formed. The fourth channel hit at the upper rail this week also happens to coincide with an upper rail hit of a smaller channel that began to take shape last summer. The confluence of resistance suggests the ratio may be set to fall in the near future.
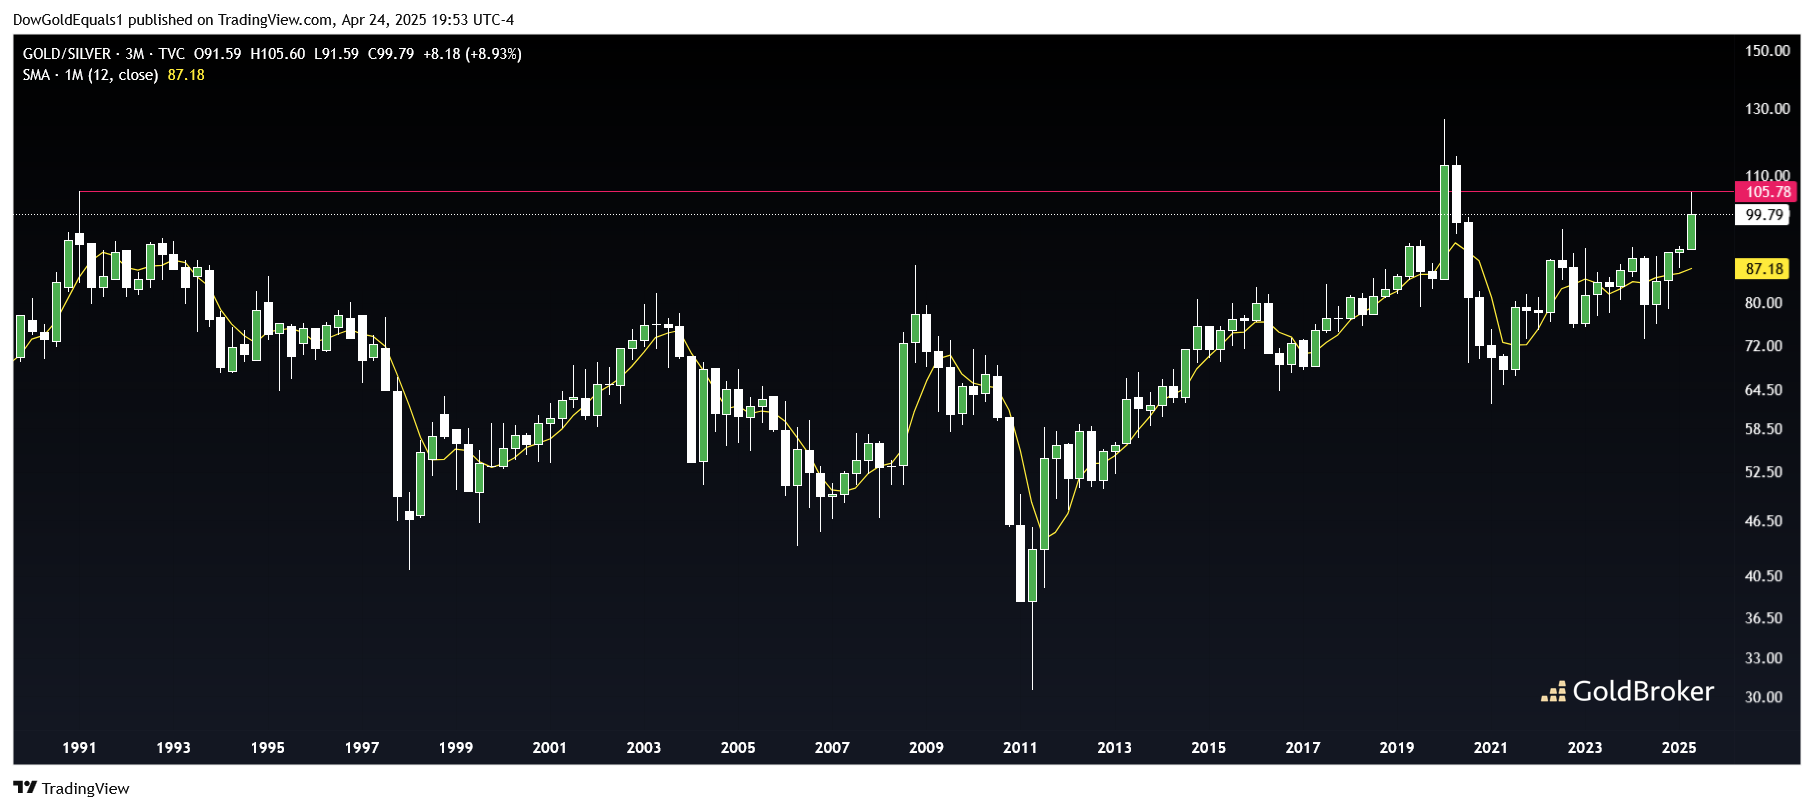
The second is a longer term chart that looks at the ratio going back to the early 1990s. Important to note is that price reversed hard off the 1991 high, which was only exceeded once briefly during the Covid metals selloff. I have also included the 12-month moving average on this chart. Notice how this moving average acts as a magnate for price, and when it gets stretched too far above or below, we tend to see sharp reversals. To my eye, it appears that price was stretched as far as it has been since the Covid and Global Financial Crisis lows, which both led to steep drops in the ratio, and much higher metals prices.
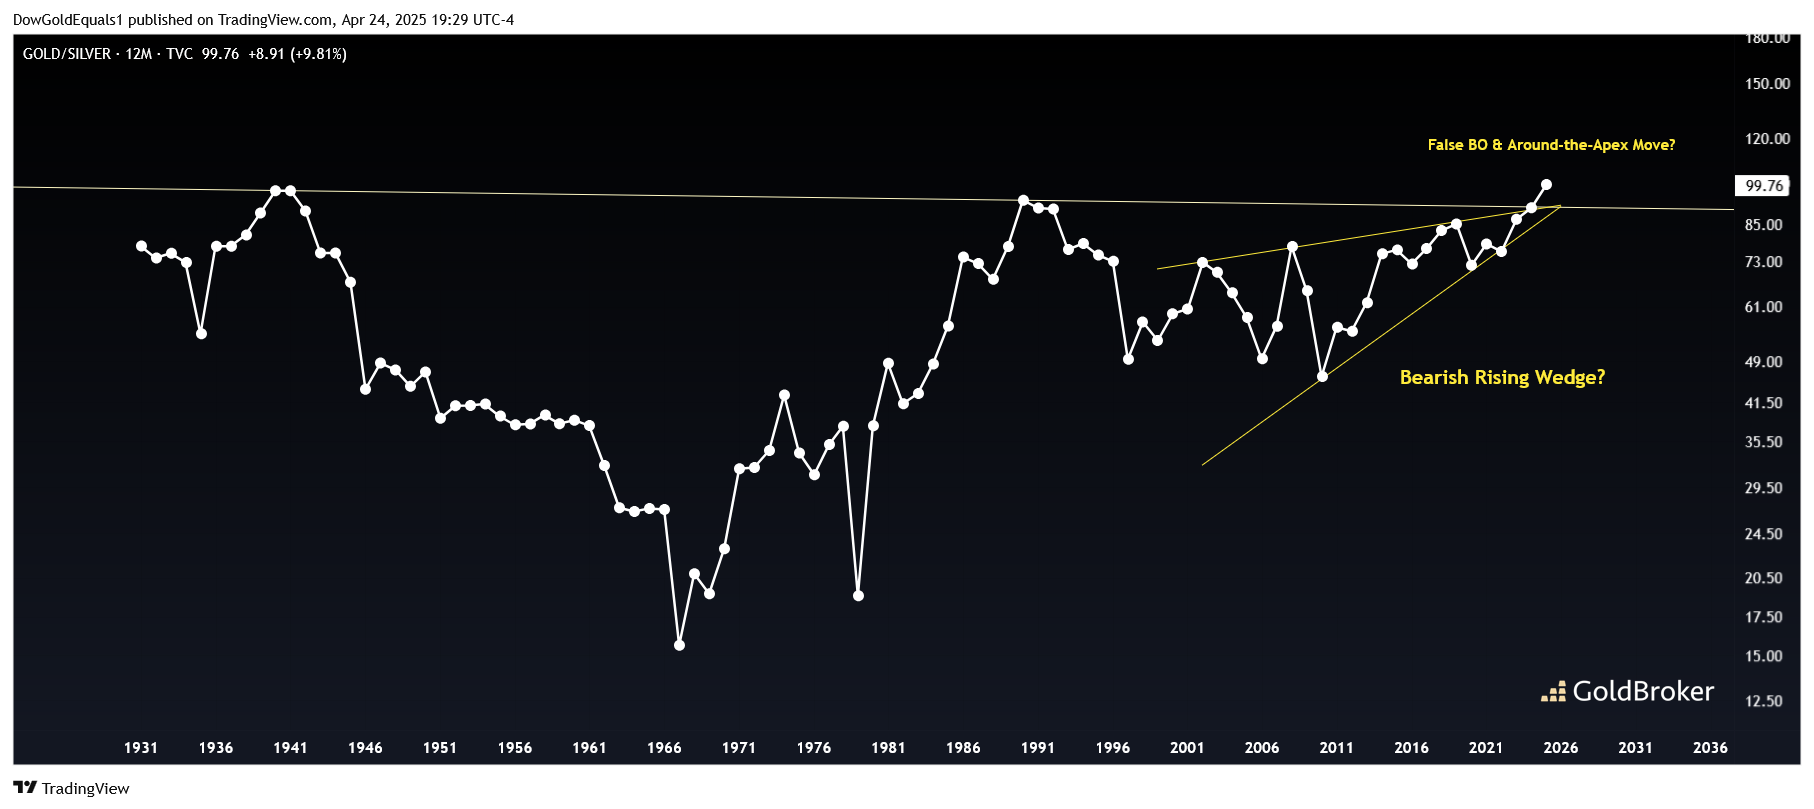
Finally we will look at the entire yearly history chart of GSR and note that price is currently above its all time resistance and has just broken out of a rising wedge. While this chart could be potentially bullish, I suspect from the evidence of the shorter term charts that we are currently witnessing a false breakout and will see an around-the-apex move lower over the course of this year and next. Should that occur, the ratio will have all the momentum it needs to fall steeply and send metals prices much, much higher.
Reproduction, in whole or in part, is authorized as long as it includes all the text hyperlinks and a link back to the original source.
The information contained in this article is for information purposes only and does not constitute investment advice or a recommendation to buy or sell.


